May 2026 Market Update: Single-Family Homes in the South Island
The Cowichan Valley housing market gained momentum this spring, with buyer activity increasing significantly while the number of homes available for sale continued to tighten. In May, single-family home sales climbed nearly 20% compared to the same month last year, while new listings and overall inventory both declined. As a result, homes sold more quickly, sellers received close to their full asking price, and market conditions remained balanced but increasingly competitive. Although average sale prices eased slightly from recent highs, values continue to hold firm overall, reflecting a market that remains resilient and attractive for both buyers and sellers.COWICHAN VALLEY
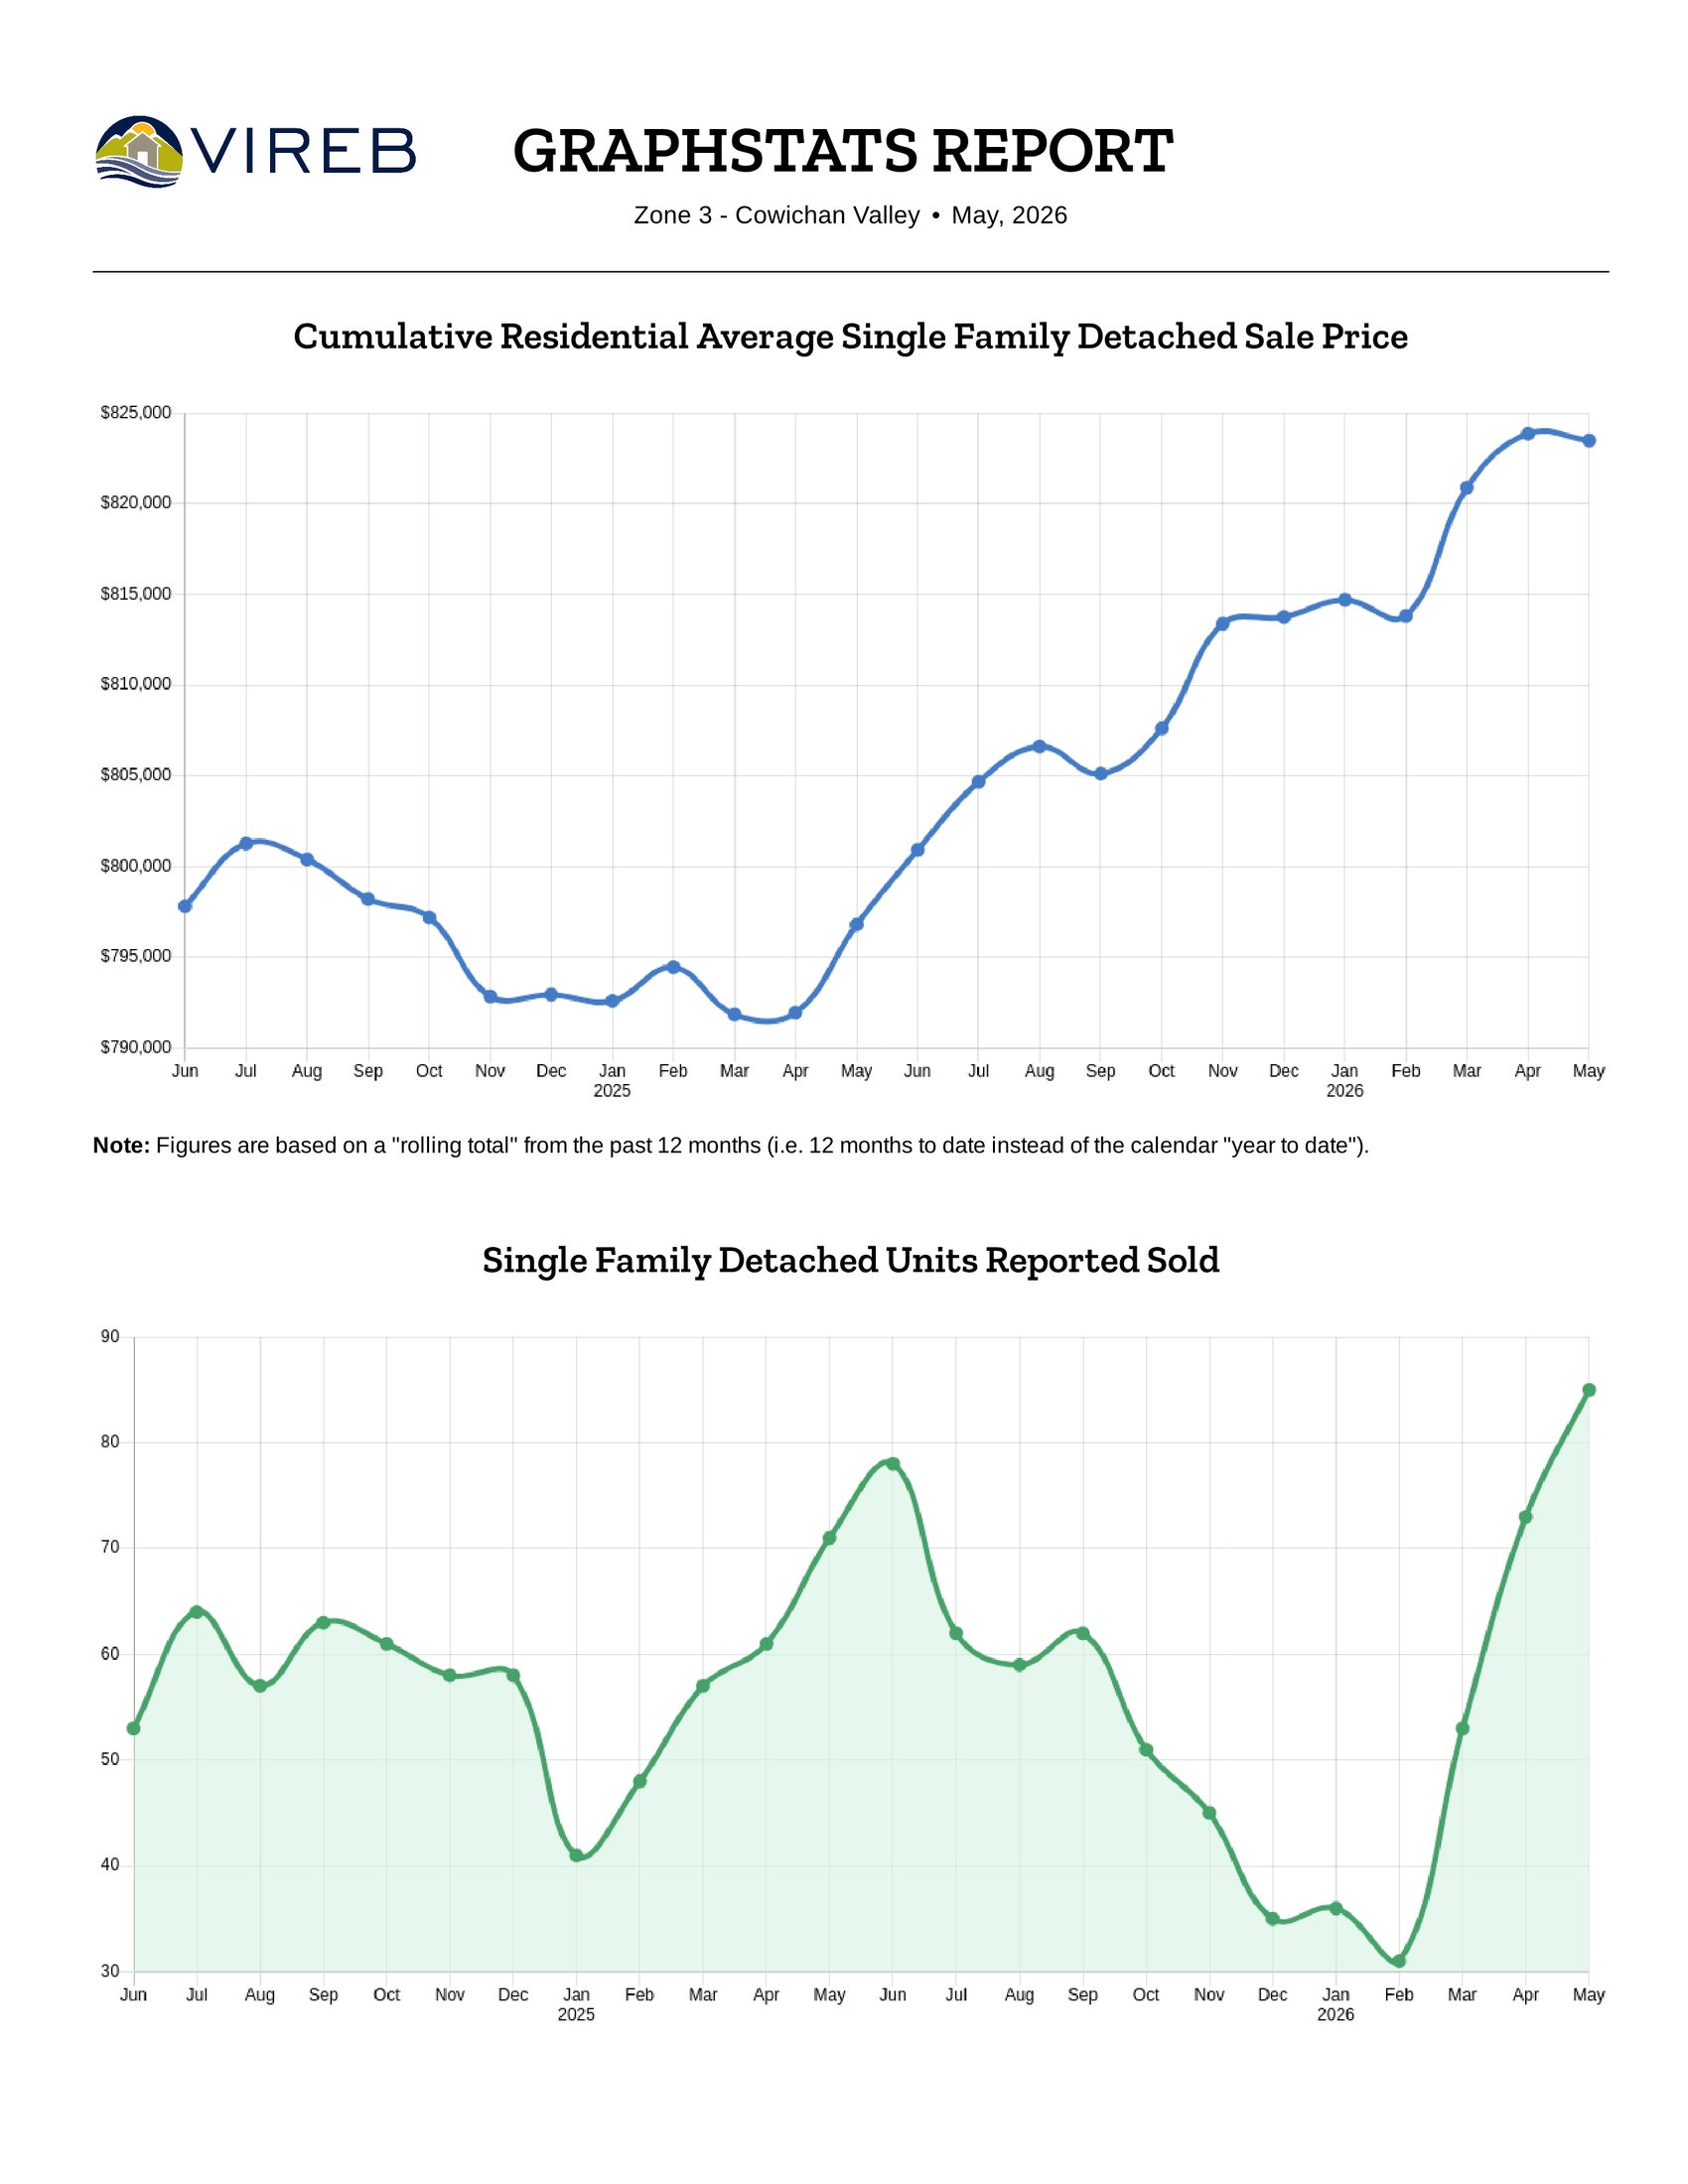
Summary: As of May 2026, the average sale price for single-family homes was $840,757, with a sell-to-list ratio of just under 97.64%.
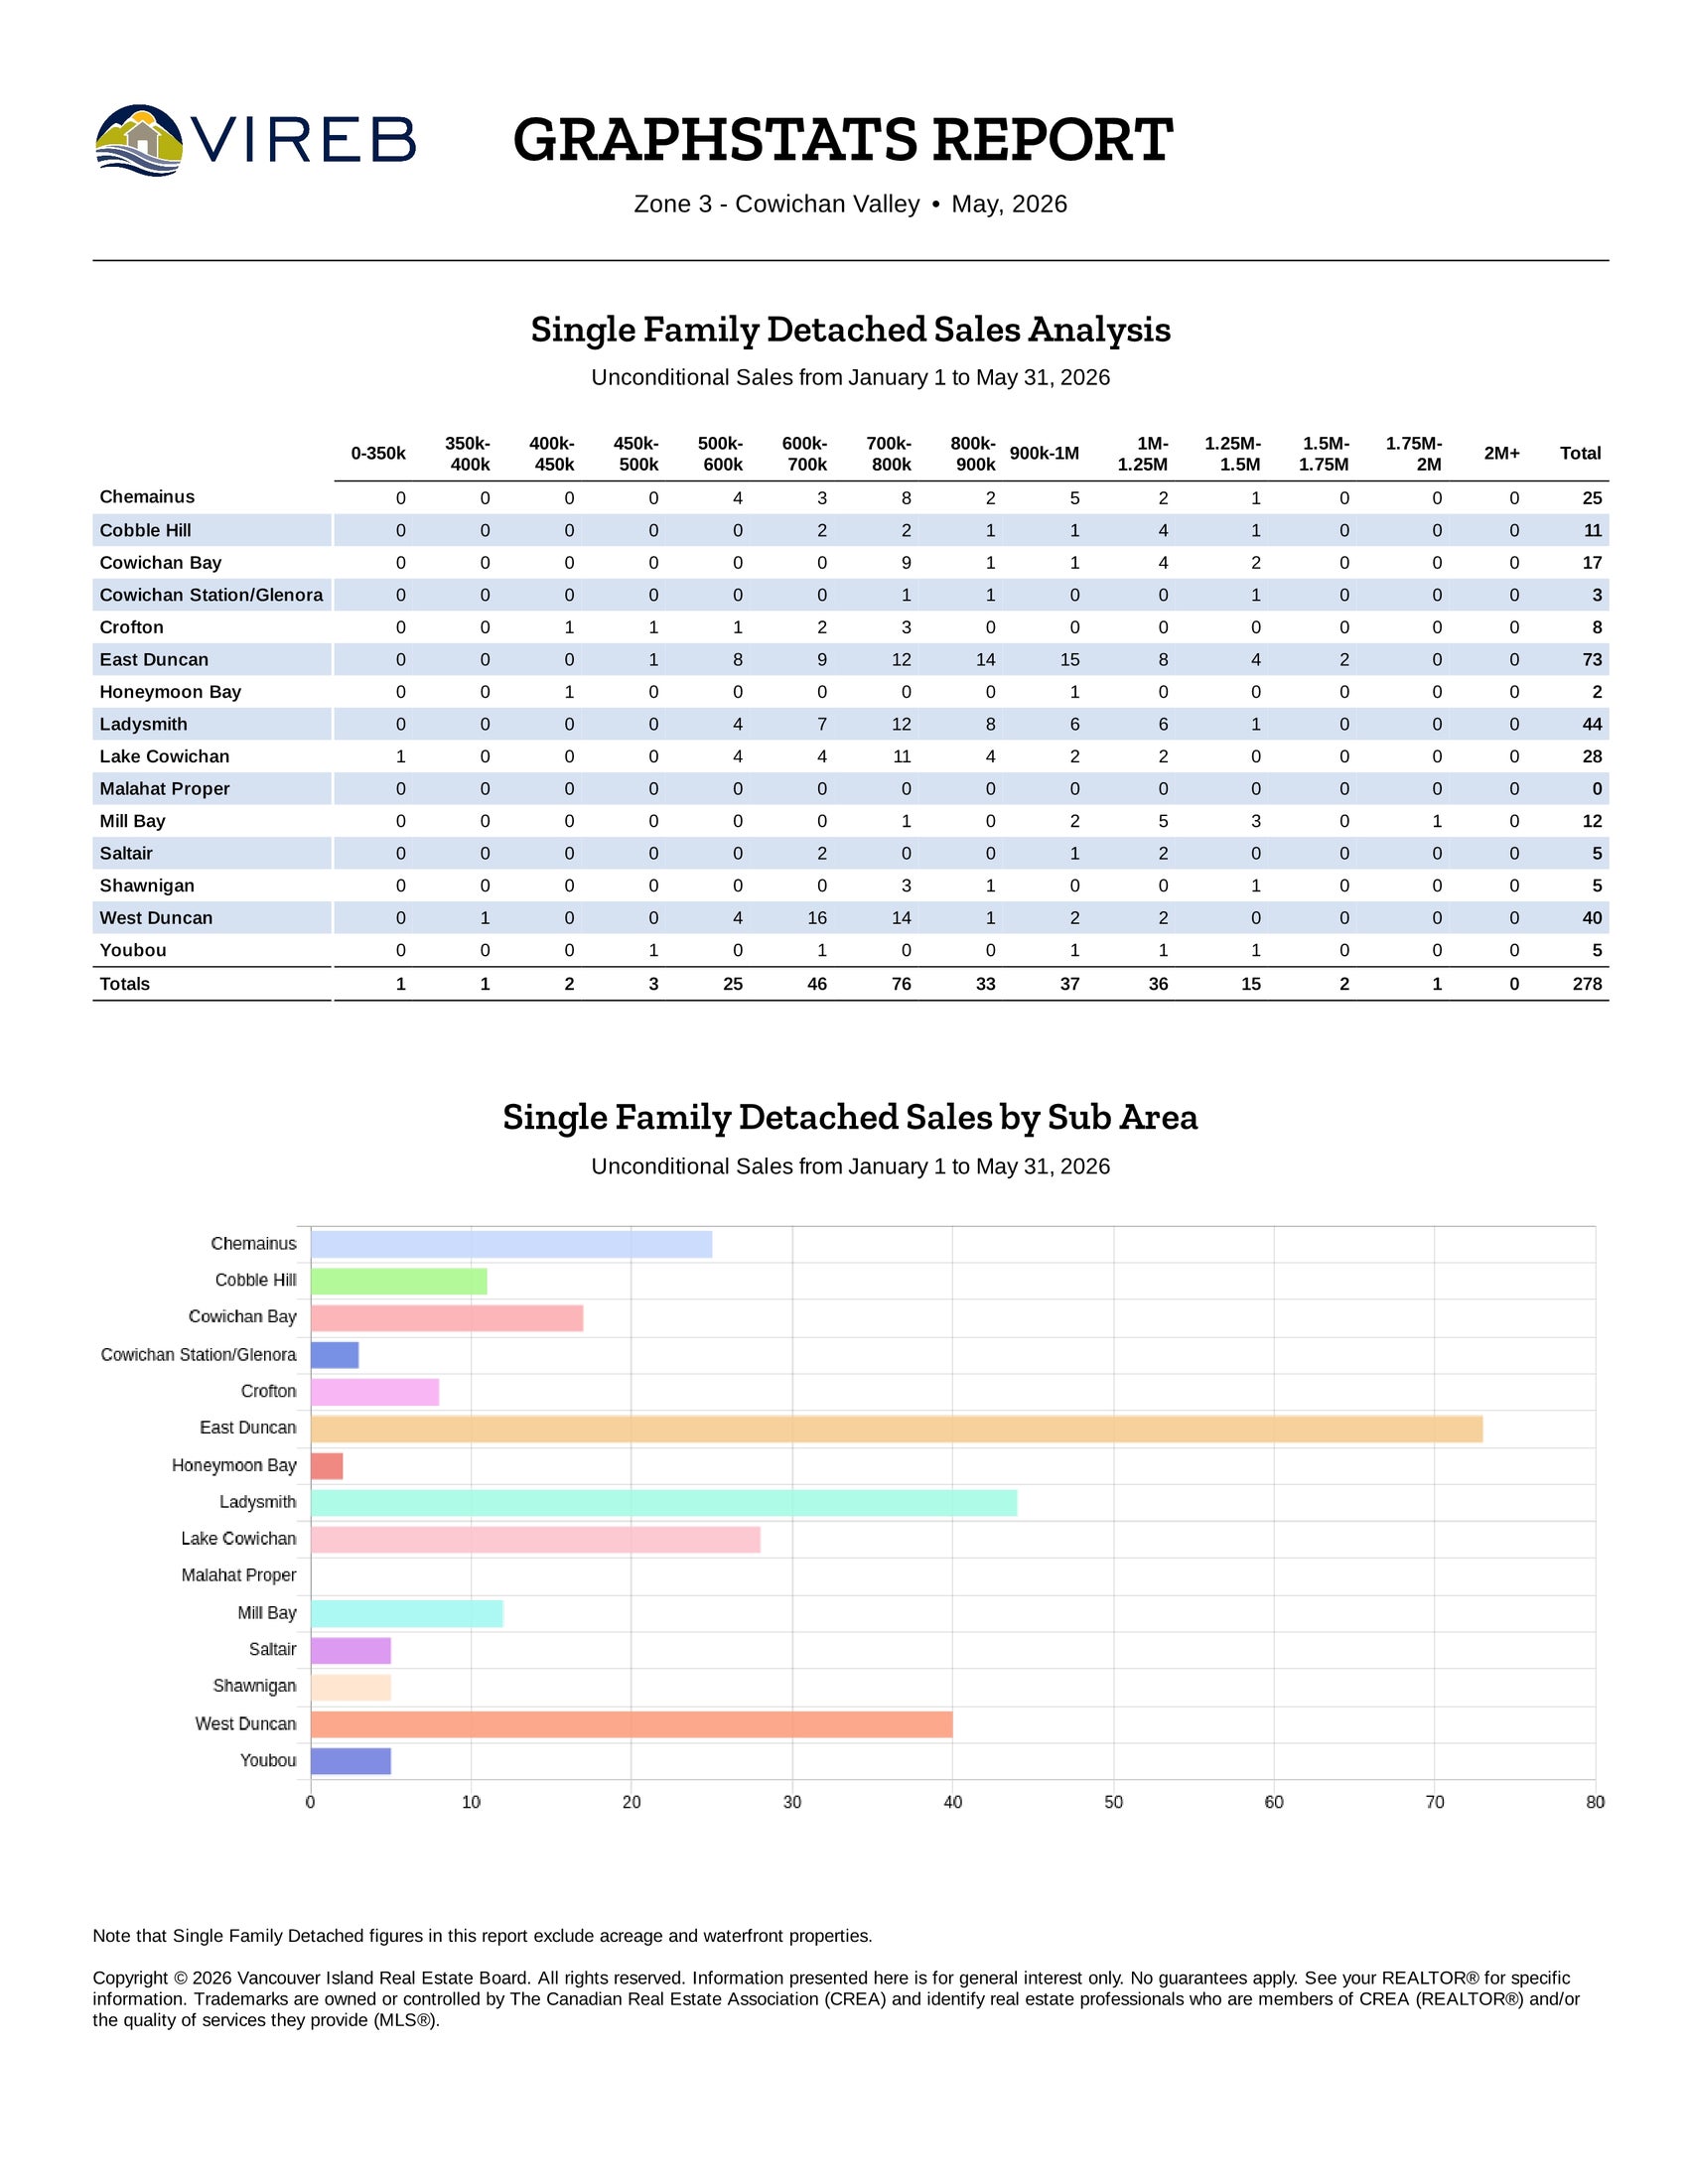
Sales Activity: A total of 85 single-family homes were sold in the Cowichan Valley during May 2026, marking a notable increase from 71 homes sold in May 2025 and up also from 75 homes in April 2026.
Listings & Inventory: The market saw 126 new single-family home listings in May 2026, a decrease of about 16.6% compared to 151 listings in May of last year. As of the end of May, 325 homes were actively listed, down from 343 homes available at the same time last year.
Pricing Trends:
• The average sale price in May 2026 was $840,757, reflecting a decrease from May 2025’s average of $847,642.
• Compared to April 2026’s average of $856,816, prices have weakened slightly.
• For the 12-month period ending in May 2026, the median sale price stood at $780,000.
Annual Performance: Over the past 12 months, 670 single-family homes were sold, which represents a 3.18% decline compared to the 692 sales in the same period ending in May 2025. Despite the slower pace of sales, the average selling price for the year is up by 3.35%.
Market Supply & Days on Market:
• The supply of homes is 4.7 months in May 2026, compared with 5.0 months in May 2025.
• Homes sold in May 2026 took an average of 40 days to sell, compared to 49 days in May last year.
This summary highlights the key market trends and performance for single-family homes in the Cowichan Valley, helping homeowners and buyers stay informed about the latest developments. Feel free to reach out for further details or if you need personalized advice!
Condo & Townhome Market Update
Condominiums
In May 2026, the condominium market saw little change with 9 units sold, up from 8 in April, and up from the 8 units sold in May of last year. The average price for condo apartments over the past 12 months ending in May rose to $419,322 - a 25% increase from last year's average of $335,369.
Townhomes
The townhome market experienced a upward trend, with 25 sales in May, a decrease from both the 14 units sold in April and 11 in May 2025 (a 127.3% year-over-year increase). The average price for townhomes over the past 12 months ending in May reached $574,245, up 2.57% from $559,846 during the same period last year.
VICTORIA
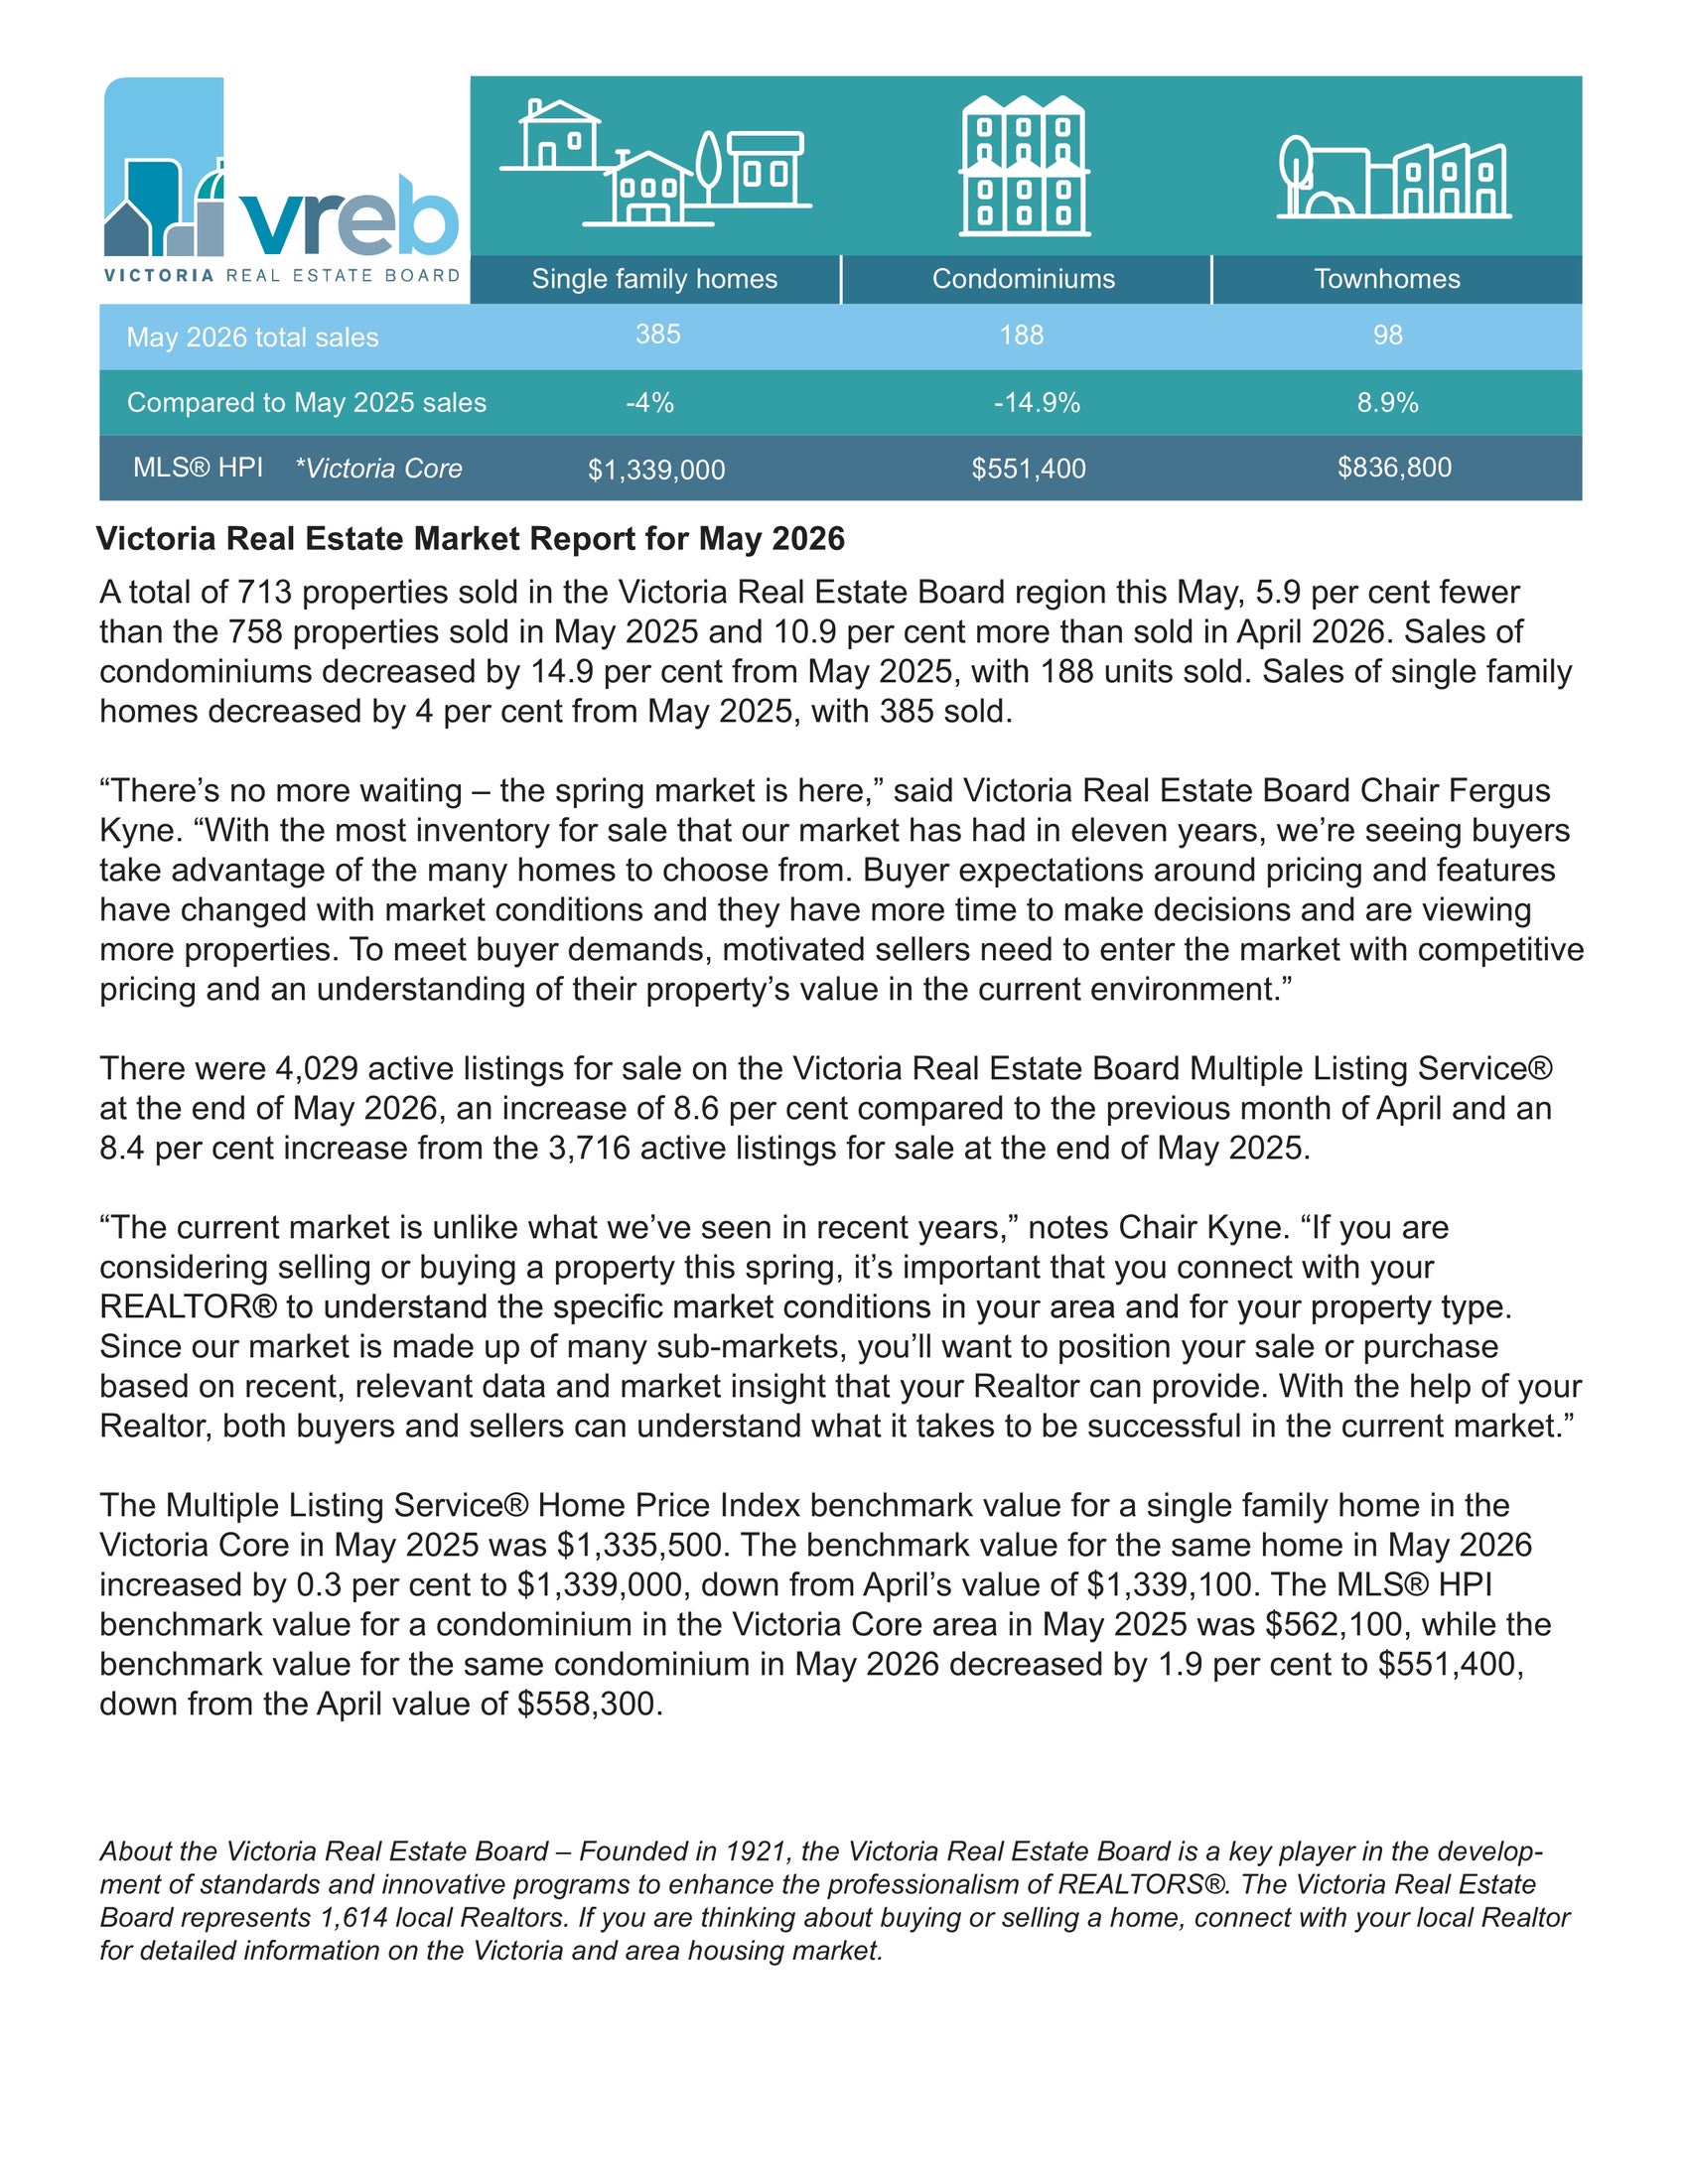
Summary: In May 2026, the benchmark price for single-family homes in the Victoria Core reached $1,339,000, reflecting a 0.3% year-over-year increase.
Summary: In May 2026, the benchmark price for single-family homes in the Victoria Core reached $1,339,000, reflecting a 0.3% year-over-year increase.

Canadian Home Sales Edge Higher in April
Ottawa, ON May 14, 2026 – The number of home sales recorded over Canadian MLS® Systems was up 0.7% on a month-over-month basis in April 2026. (Chart A)
“While home sales were up only modestly from March to April, the small increase reflected a slow start to the month with a stronger handoff into May, alongside falling days on market and stabilizing prices,” said Shaun Cathcart, Senior Economist with the Canadian Real Estate Association (CREA). “This latest bout of global economic uncertainty and higher mortgage rates means the previously expected rebound in housing markets this year will continue to be muted, but it does not mean there will be no upward momentum at all.”
April Highlights:
• National home sales edged up 0.7% month-over-month.
• Actual (not seasonally adjusted) monthly activity came in 4% below April 2025.
• The number of newly listed properties jumped 4.1% on a month-over-month basis.
• The MLS® Home Price Index (HPI) edged down 0.1% month-over-month and was down 4.2% on a year-over-year basis.
• The actual (not seasonally adjusted) national average sale price was up 2.2% on a year-over-year basis in April 2026.
• National home sales edged up 0.7% month-over-month.
• Actual (not seasonally adjusted) monthly activity came in 4% below April 2025.
• The number of newly listed properties jumped 4.1% on a month-over-month basis.
• The MLS® Home Price Index (HPI) edged down 0.1% month-over-month and was down 4.2% on a year-over-year basis.
• The actual (not seasonally adjusted) national average sale price was up 2.2% on a year-over-year basis in April 2026.
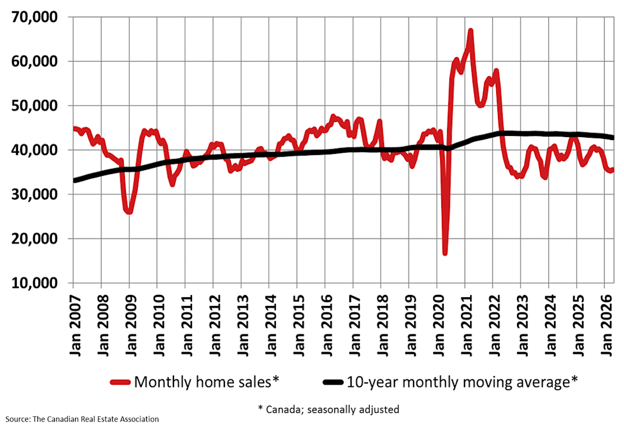
Chart A
New listings jumped 4.1% on a month-over-month basis in April 2026, marking the traditional starting point for the spring market.
With the gain in new supply outpacing sales within the month of April, the national sales-to-new listings ratio eased to 45.6% compared to 47.1% in March. That said, this could reflect a timing issue between when properties are listed and when they eventually sell. The long-term average for the national sales-to-new listings ratio is 54.8%, with readings roughly between 45% and 65% generally consistent with balanced housing market conditions.
“While many buyers remain in a wait and see mode, the April national housing numbers did move in the right direction across the board,” said Garry Bhaura, CREA Chair. “With the spring listings now coming onto the market, sales were up, days on market were down, and prices continued to stabilize. The data trends suggest more of the same for May, so if you’re ready to get into the market as a buyer or as a seller, start working with a local REALTOR® today.”
There were 187,647 properties listed for sale on all Canadian MLS® Systems at the end of April 2026, up 2.2% from a year earlier but 6.1% below the long-term average for that time of the year.
There were 5.2 months of inventory on a national basis at the end of April 2026, up slightly from February and March due to the influx of new spring listings. This remains very close to the long-term average for the measure of five months. Based on one standard deviation above and below that long-term average, a seller’s market would be below 3.6 months, and a buyer’s market would be above 6.4 months.
The National Composite MLS® Home Price Index (HPI) edged down just 0.1% on a month-over-month basis in April, the smallest decline since October 2025. This aligns with sale-to-list price ratios that have been tightening up and days on market that have been edging lower in recent months. Price stabilization is an important milestone necessary for buyers to eventually start re-entering the market in larger numbers.
The non-seasonally adjusted National Composite MLS® HPI was down 4.2% compared to April 2025, the smallest year-over-year decline so far in 2026. (Chart B)
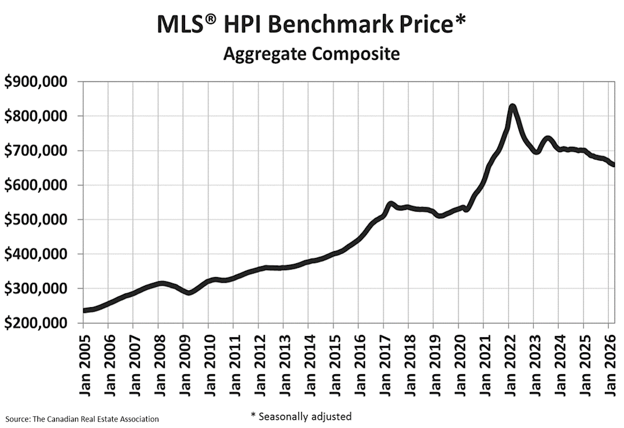
Chart B
Regionally, prices remain down on a year-over-year basis in British Columbia, Alberta, and Ontario, offsetting gains in other provinces.
The non-seasonally adjusted national average home price was $695,412 in April 2026, up 2.2% from the same month last year.
The next CREA statistics package will be published on Tuesday, June 16, 2026.