August 2025 Market Update: Single-Family Homes in the South Island
The Cowichan Valley market held strong this summer with a slower market. Prices are slightly lower than July but still above last year, and while inventory is tighter, homes are selling in just under two months. With sales up more than 20% over the past year, the market continues to offer opportunities for both buyers and sellers in what is a balanced market.
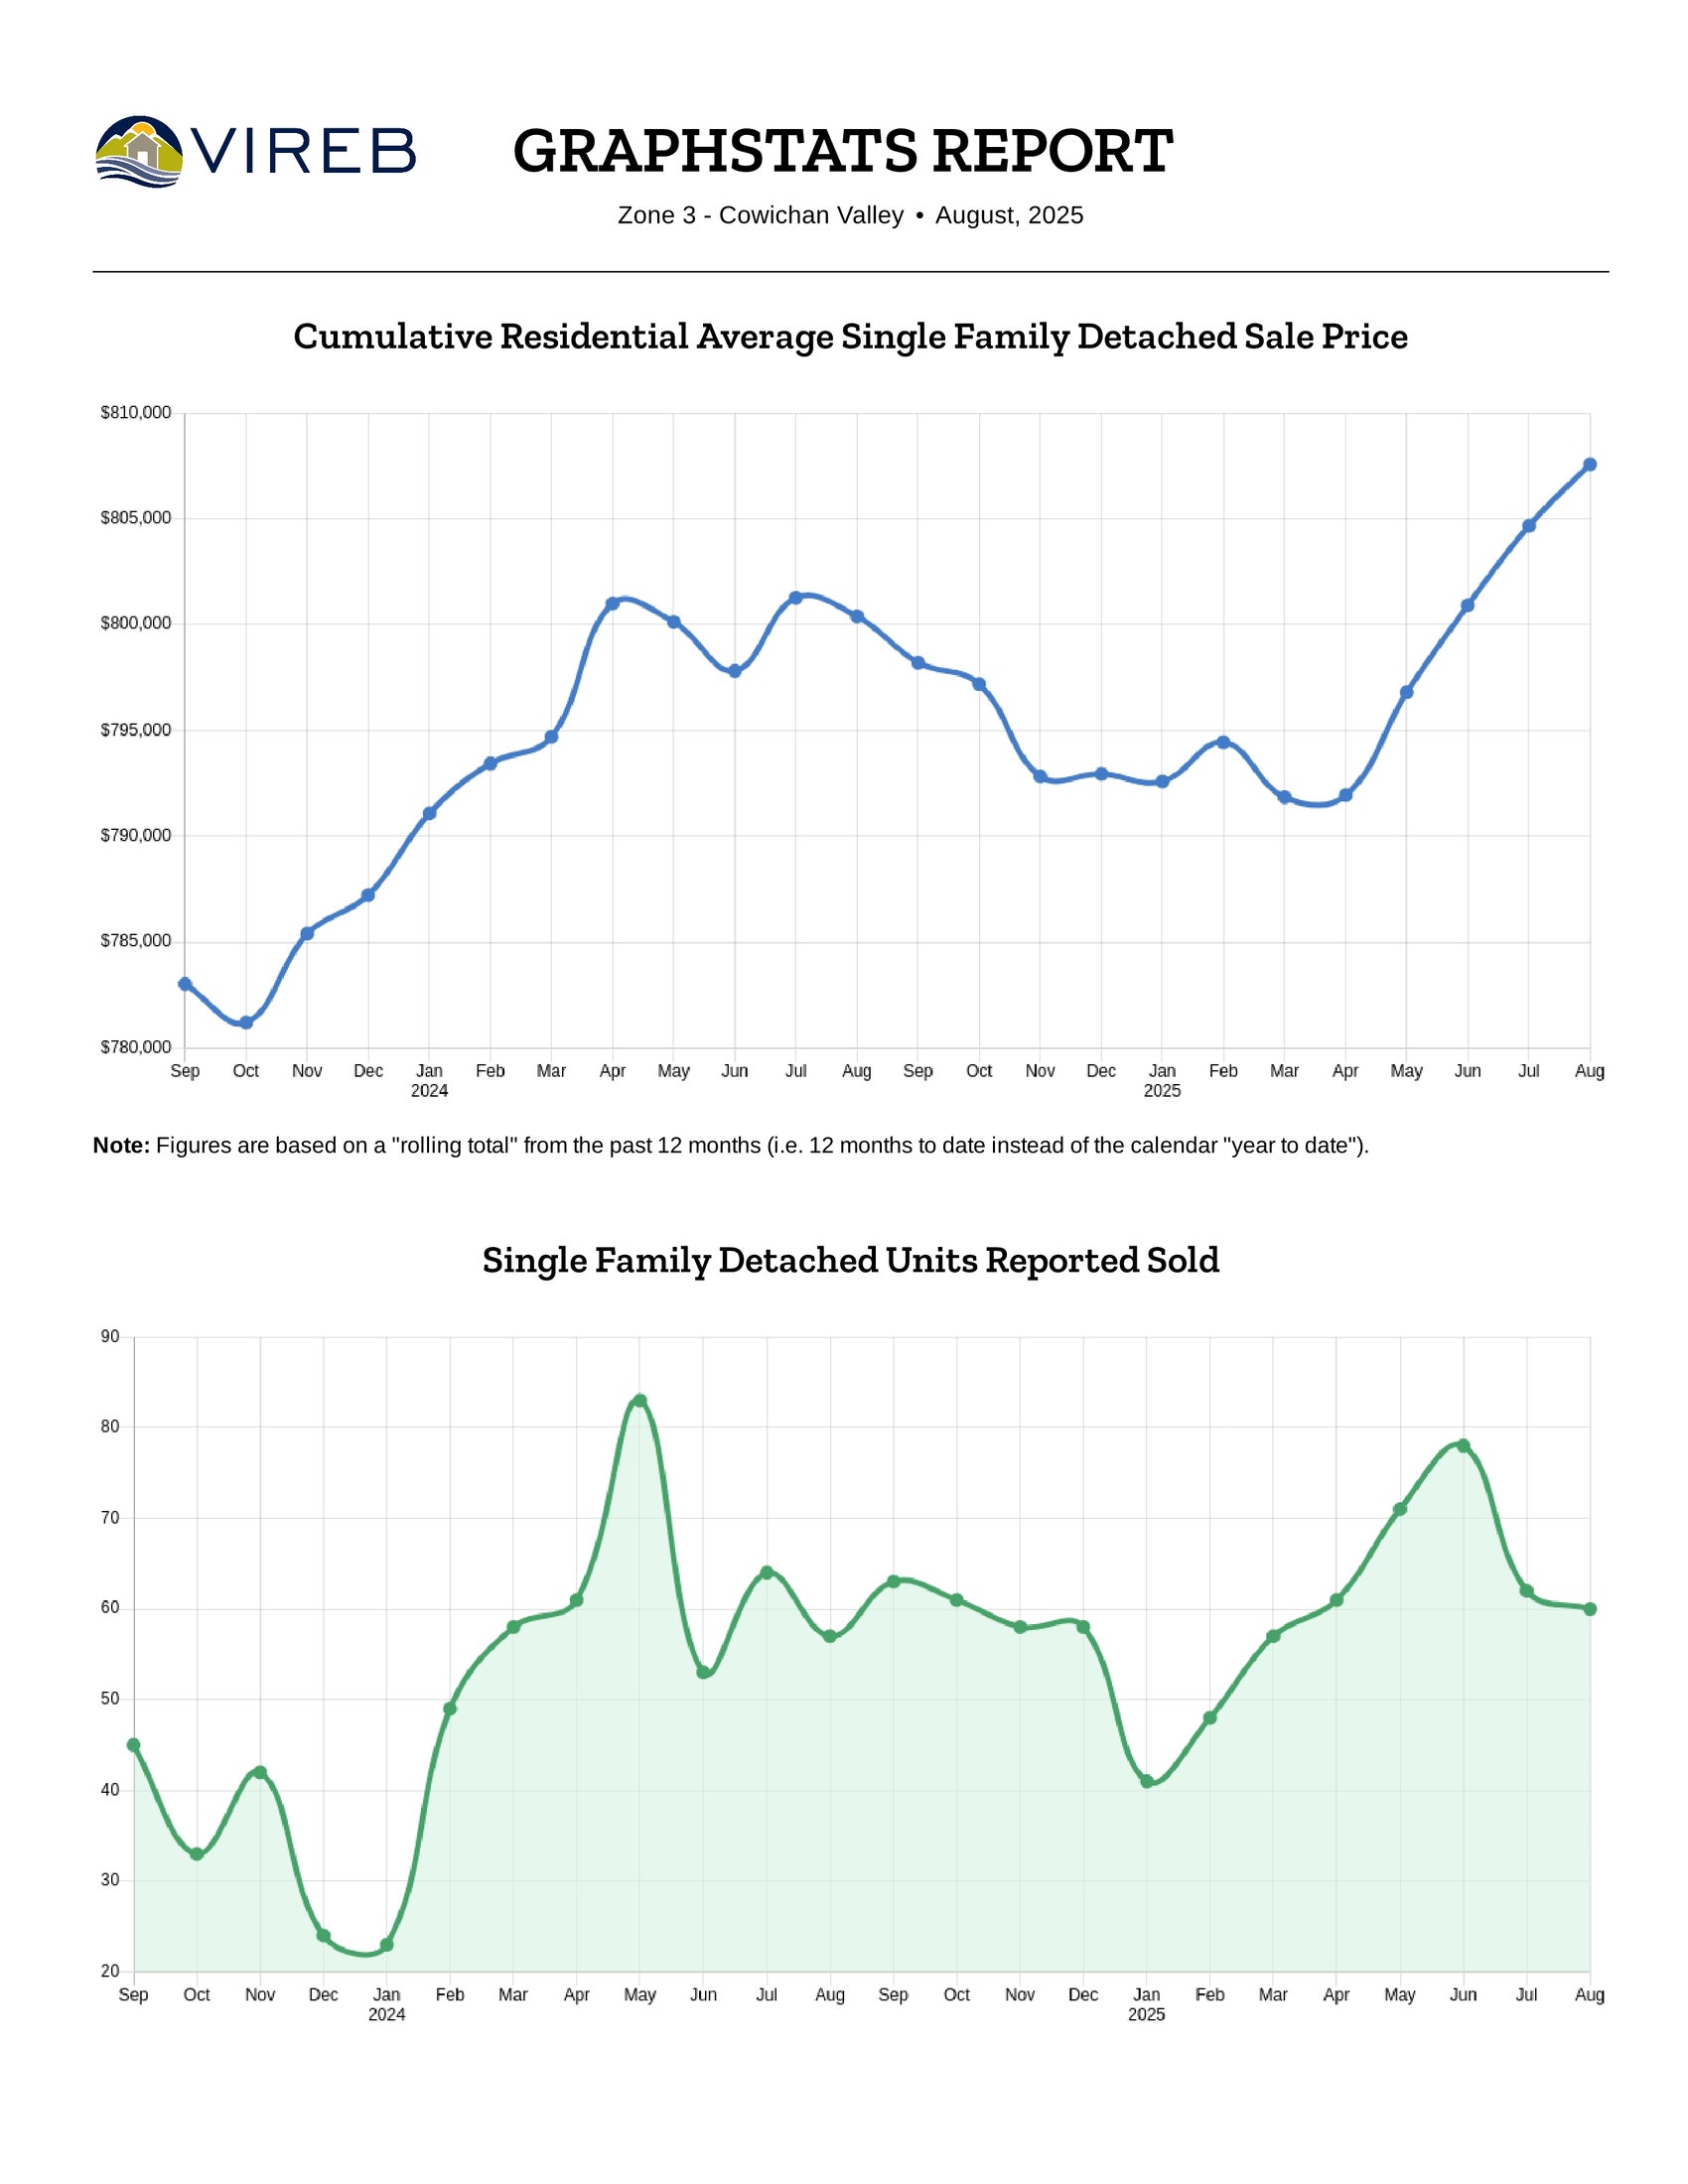
Summary: As of August 2025, the average sale price for single-family homes was $ 827,515, with a sell-to-list ratio of just under 56%.
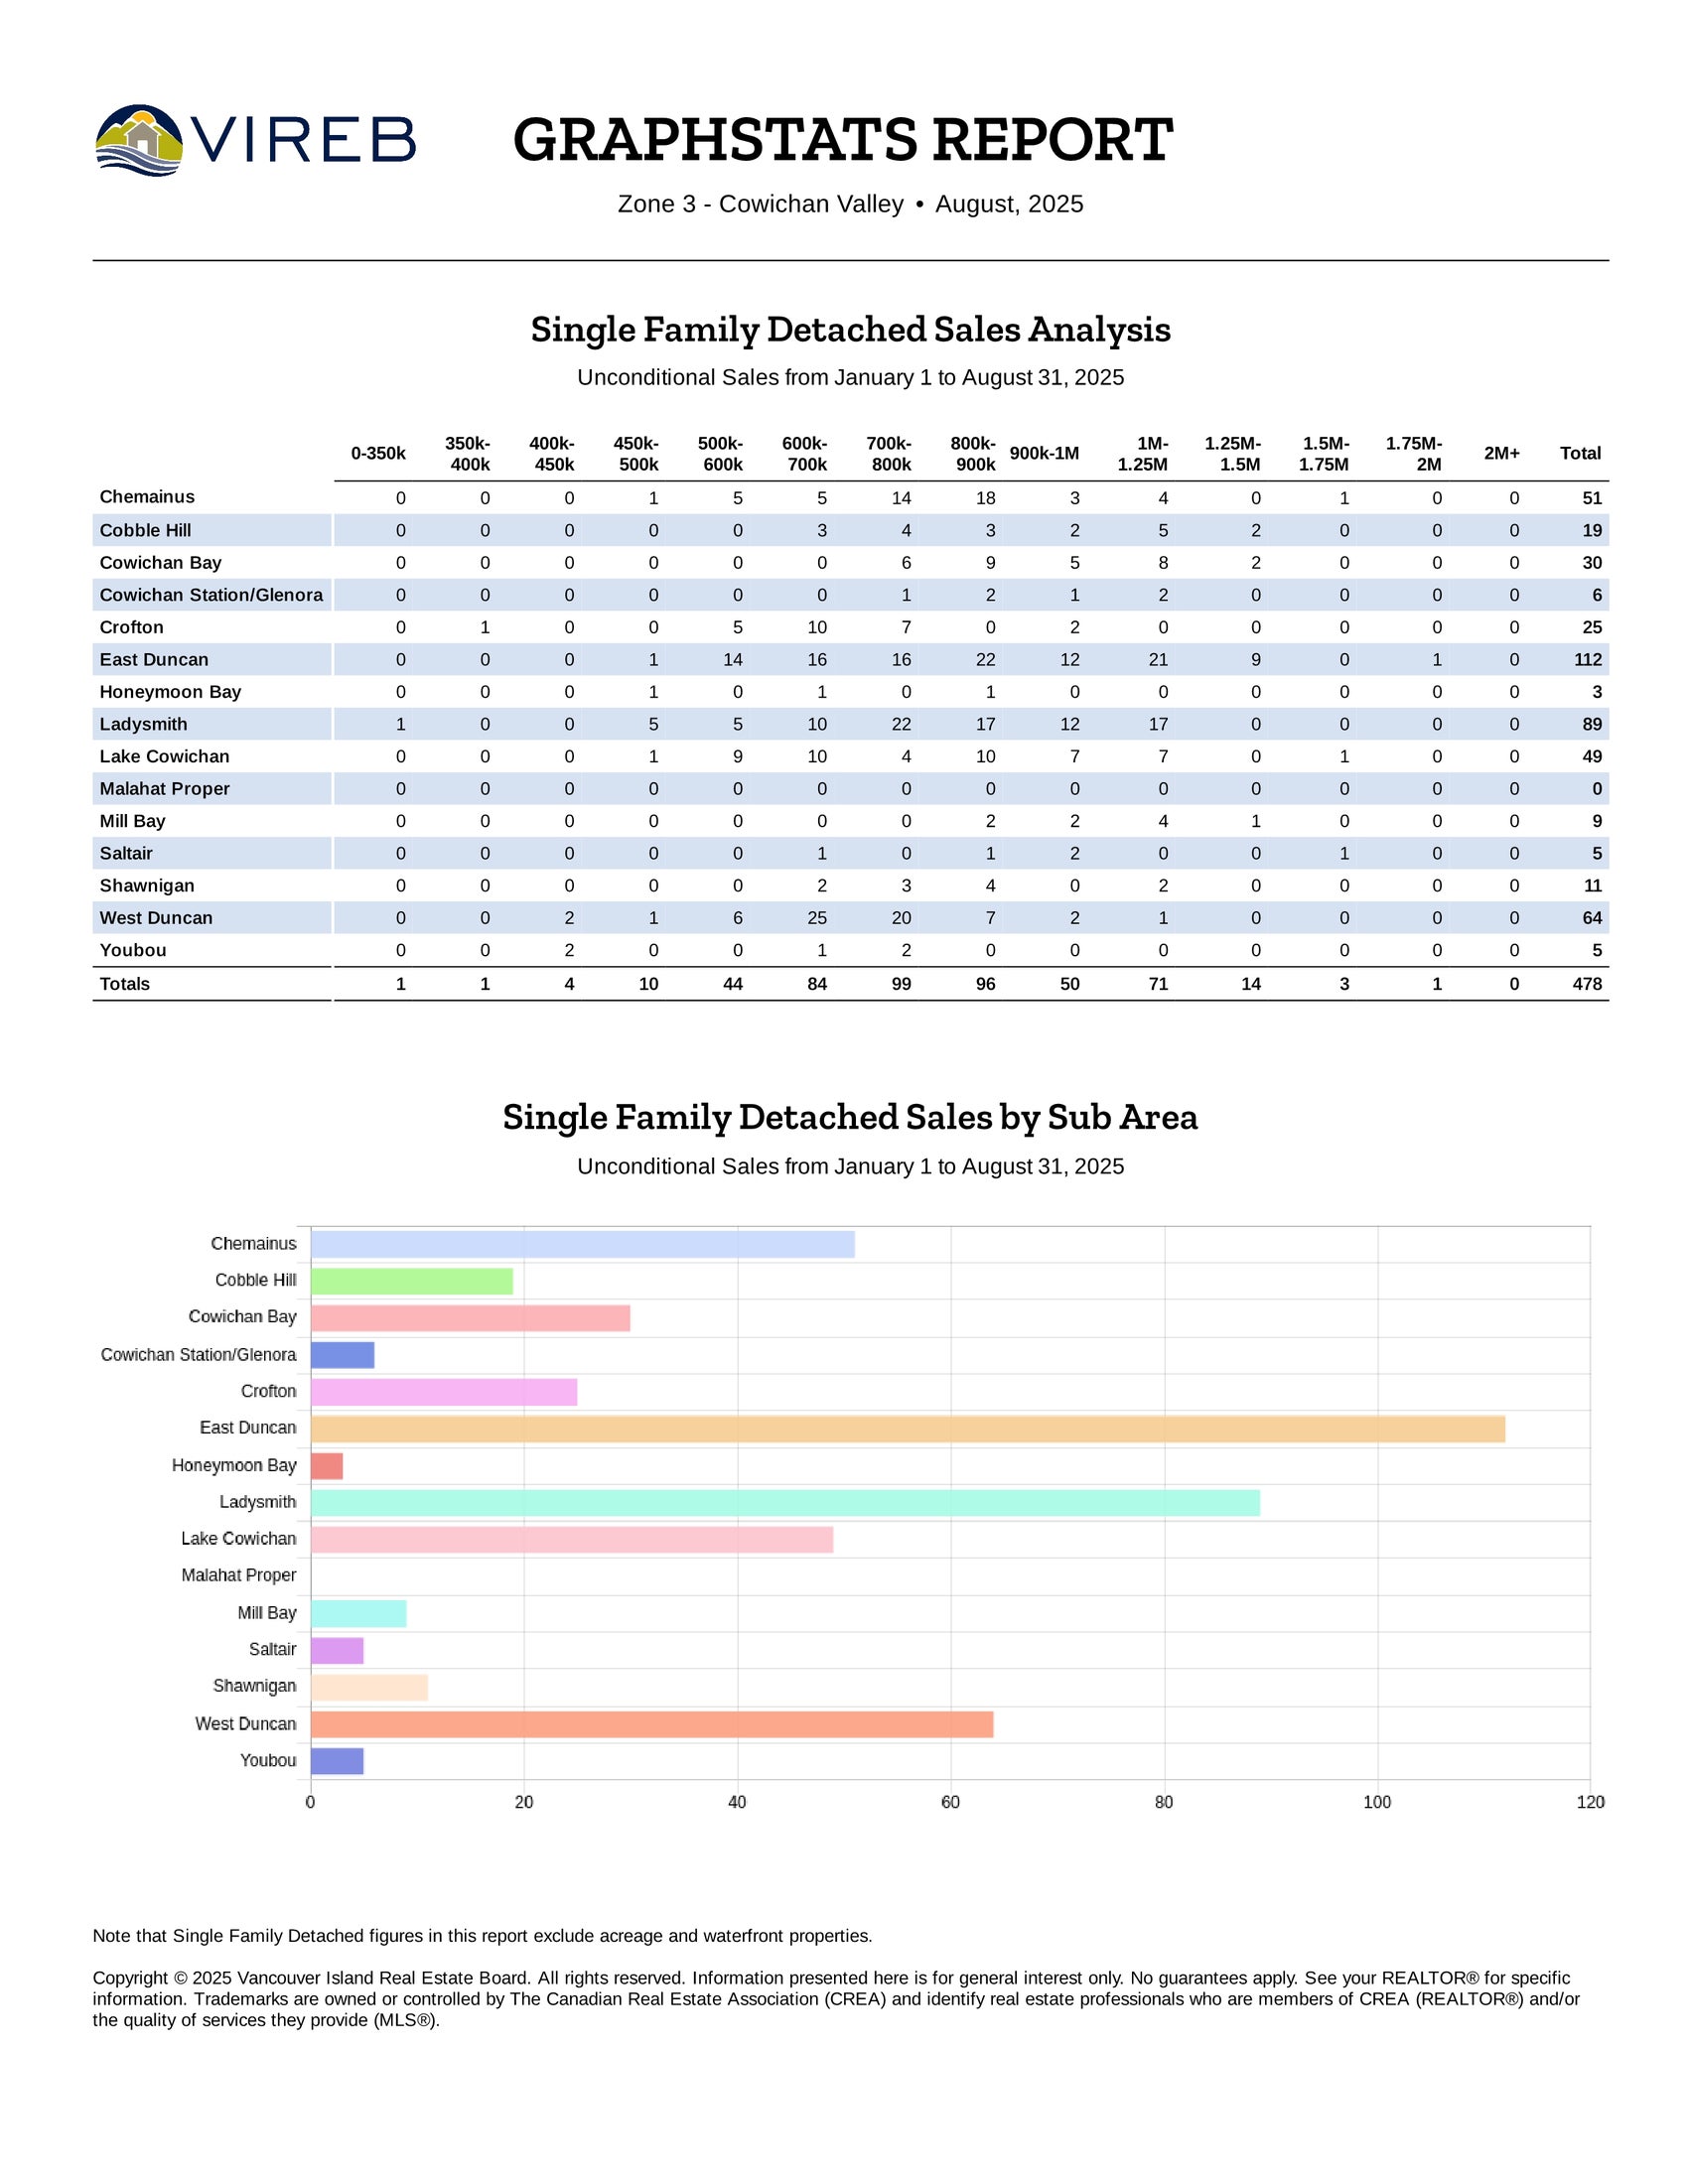
A total of 60 single-family homes were sold in the Cowichan Valley during August 2025, marking an increase from 57 homes sold in August 2024 and decrease from 71 homes in July 2025.
Listings & Inventory: The market saw 93 new single-family home listings in August, a significant drop of 9% compared to 102 listings in August of last year. As of the end of August, 268 homes were actively listed, down considerably from 316 homes available at the same time last year.
Pricing Trends:
• The average sale price in August 2025 was $827,515, reflecting an upward change from August 2024’s average of $792,063.
• Compared to July 2025’s average of $888,653, prices have softened.
• For the 12-month period ending in August 2025, the median sale price stood at $785,500.
Annual Performance: Over the past 12 months, 718 single-family homes were sold, which represents a 21% incline compared to the 592 sales in the same period ending in August 2024. Despite the pace of sales, the average selling price for the year is up by about1%.
Market Supply & Days on Market:
• The supply of homes decreased to 5.8 months in August 2025, down from 7.2 months in August 2024.
• Homes sold in August 2025 took an average of 57 days to sell, compared to 55 days in August last year.
This summary highlights the key market trends and performance for single-family homes in the Cowichan Valley, helping homeowners and buyers stay informed about the latest developments. Feel free to reach out for further details or if you need personalized advice!
Condo & Townhome Market Update
Condominiums
In August, the condominium market saw a decrease with 12 units sold, compared to 17 in July. However, sales are up considerably from the 6 units sold in August of last year. The average price for condo apartments over the past 12 months ending in August 2025 fell to $346,243 - a 2% decrease from last year's average of $353,191.
Townhomes
The townhome market experienced an up/downward trend, with 14 sales in August, a decrease of just one from the 15 units sold in July 2025 and an increase from 12 in August 2024 (a 16.7% year-over-year increase). The average price for townhomes over the past 12 months ending in August reached $569,255, down just under 1% from $574,343 during the same period last year.
VICTORIA
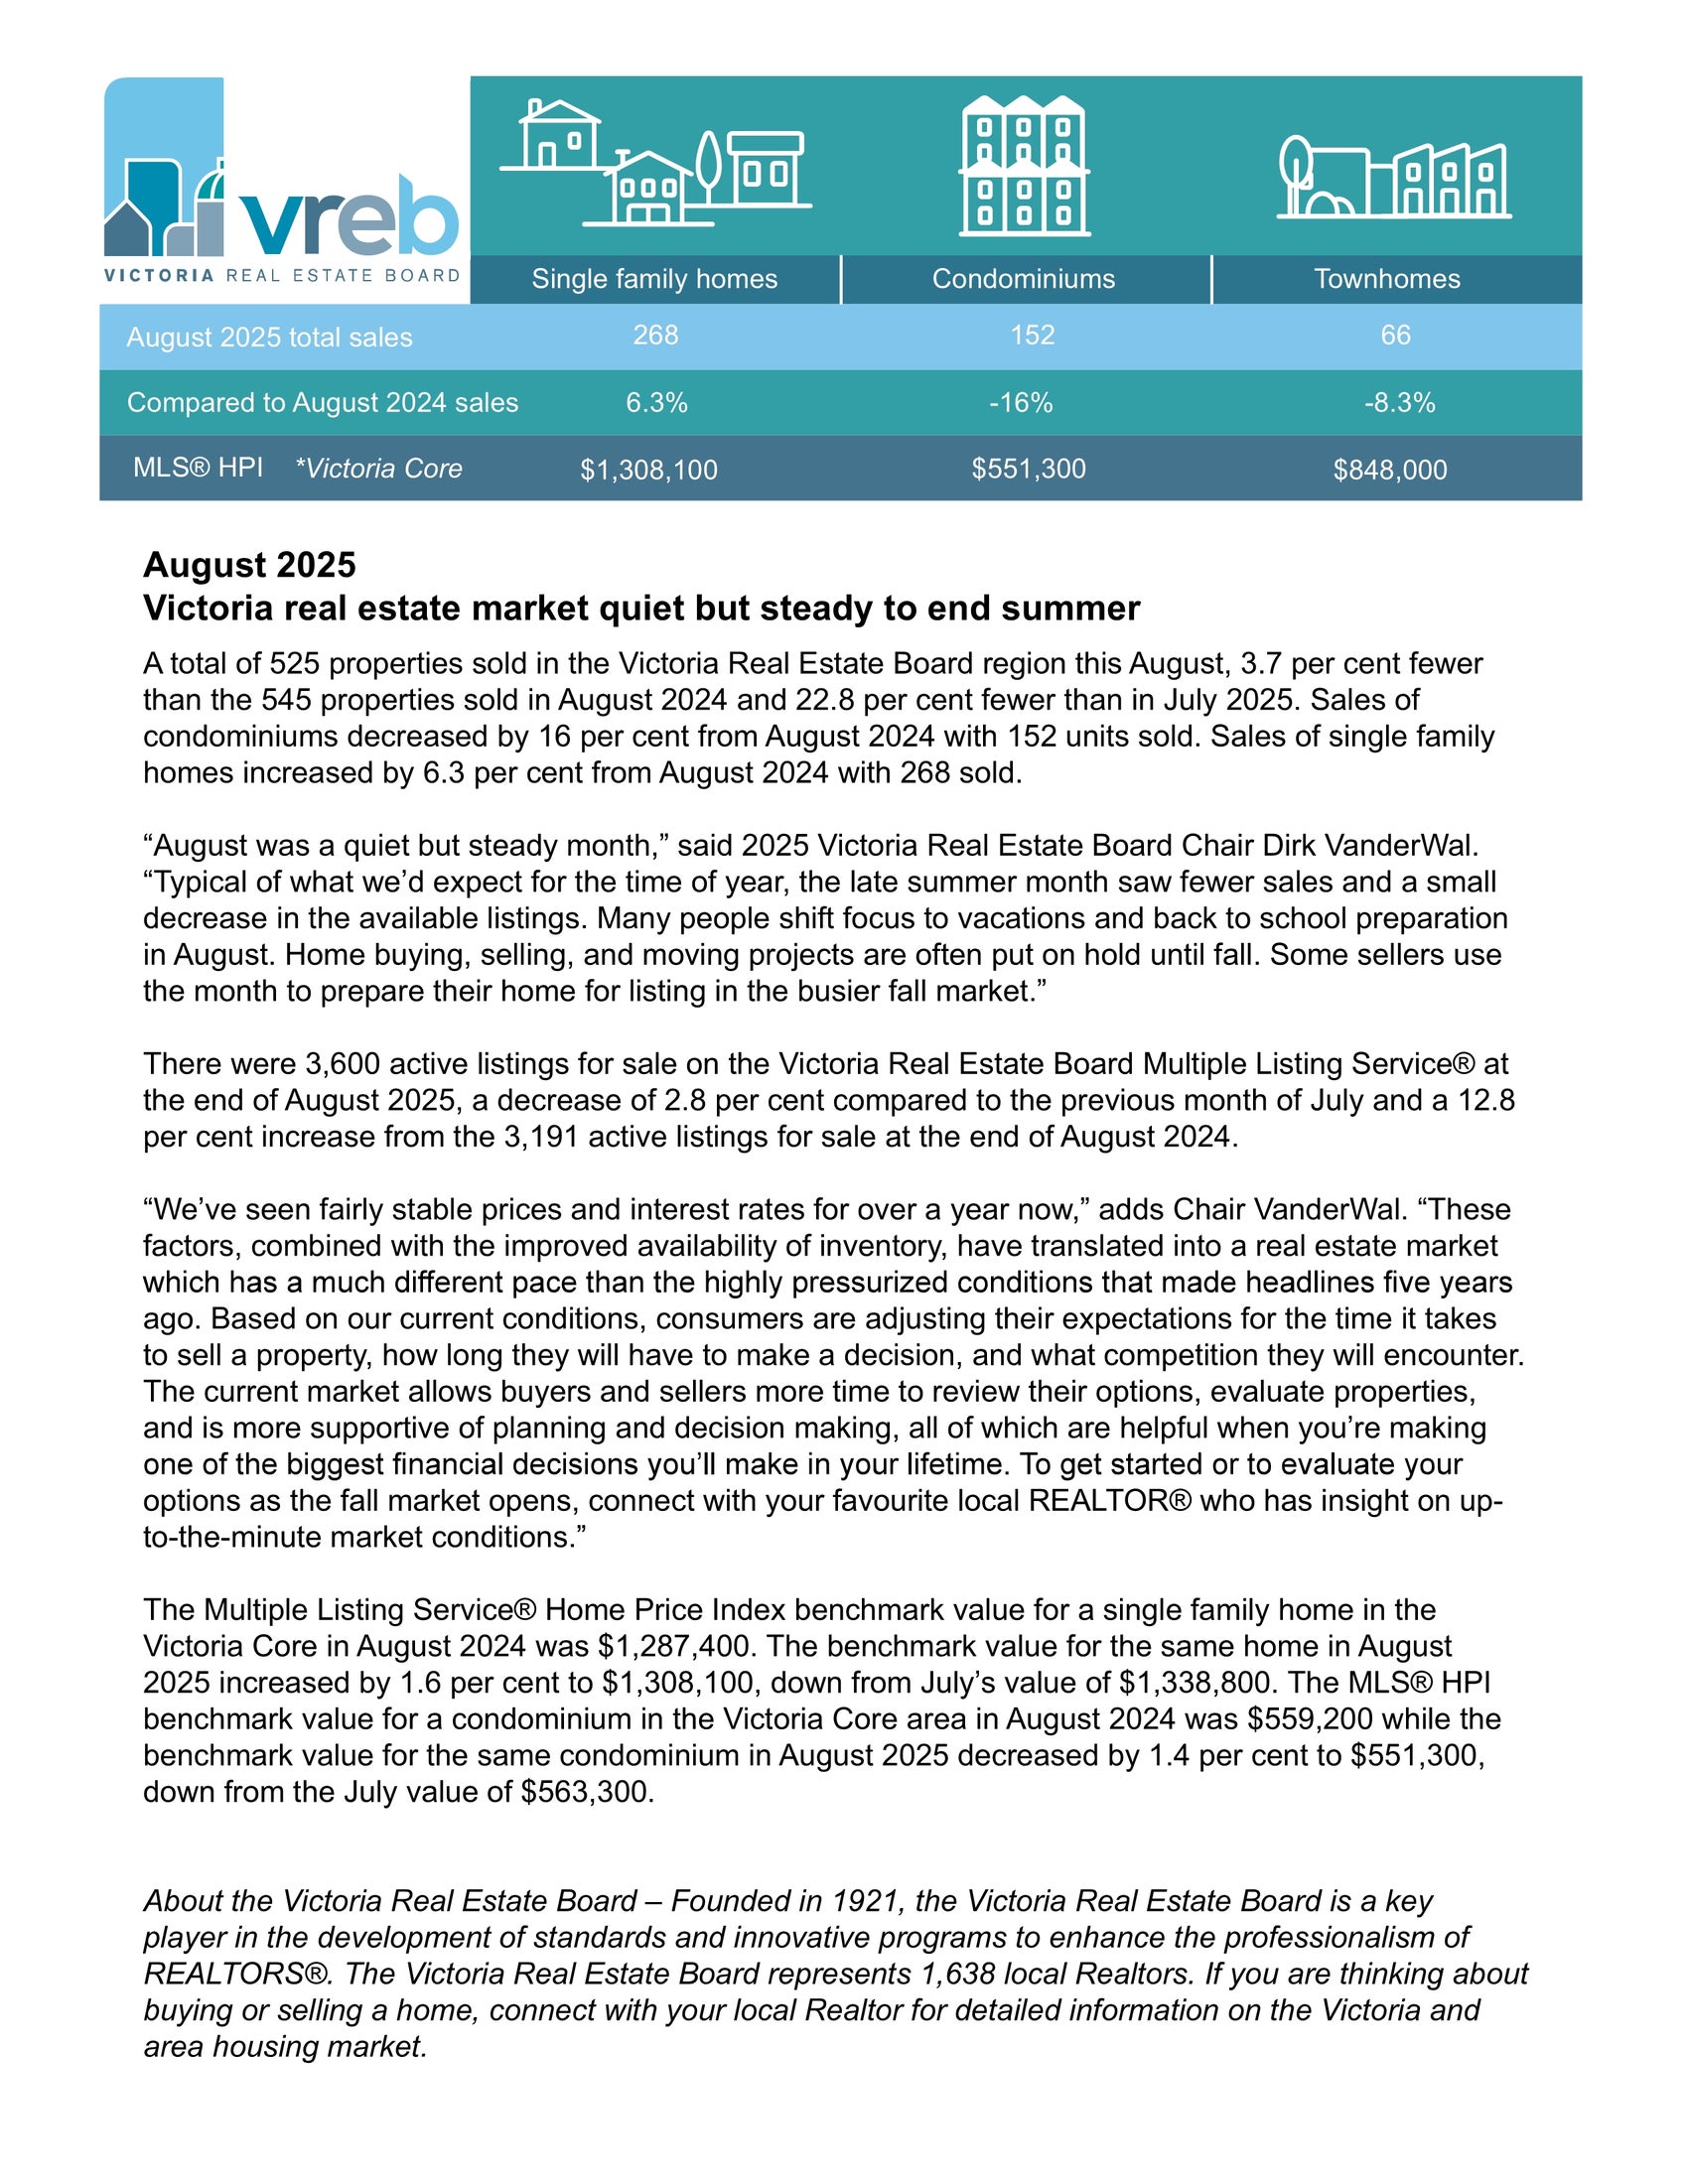
Summary: In August 2025, the benchmark price for single-family homes in the Victoria Core reached $1,308,100, reflecting a 6.3% year-over-year increase.

Canadian Home Sales Continue to Climb in July, National Benchmark Price Remains Steady
Ottawa, ON August 15, 2025
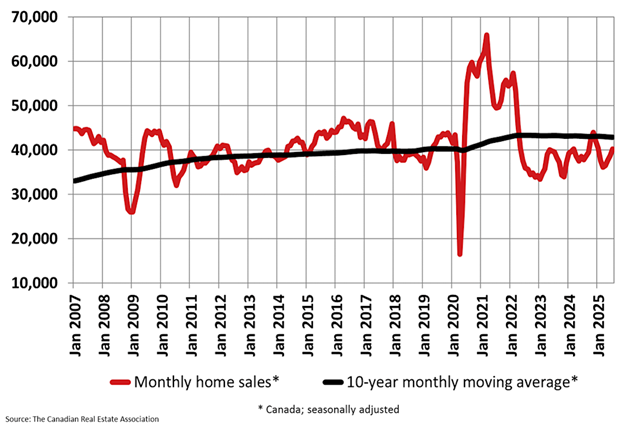
The number of home sales recorded over Canadian MLS® Systems climbed 3.8% on a month-over-month basis in July 2025. Building on gains recorded over the previous three months, transactions are now up a cumulative 11.2% since March. (Chart A)
The July increase in home sales was again led overwhelmingly by the Greater Toronto Area (GTA), where transactions, while still historically low, have now rebounded a cumulative 35.5% since March.
“With sales posting a fourth consecutive increase in July, and almost 4% at that, the long-anticipated post-inflation crisis pickup in housing seems to have finally arrived,” said Shaun Cathcart, CREA’s Senior Economist. “Looking ahead a little bit, it will be interesting to see how buyers react to the burst of new supply that typically shows up in the first half of September.”
July Highlights:
• National home sales were up 3.8% month-over-month.
• Actual (not seasonally adjusted) monthly activity came in 6.6% above July 2024.
• The number of newly listed properties was unchanged (+0.1%) on a month-over-month basis.
• The MLS® Home Price Index (HPI) was unchanged month-over-month and was down 3.4% on a year-over-year basis.
• The actual (not seasonally adjusted) national average sale price edged up 0.6% on a year-over-year basis.
New supply was little changed (+0.1%) month-over-month in July. Combined with the notable increase in sales, the national sales-to-new listings ratio rose to 52%, up from 50.1% in June and 47.4% in May. The long-term average for the national sales-to-new listings ratio is 54.9%, with readings roughly between 45% and 65% generally consistent with balanced housing market conditions.
There were 202,500 properties listed for sale on all Canadian MLS® Systems at the end of July 2025, up 10.1% from a year earlier and in line with the long-term average for that time of the year.
“Activity continues to pick up through the transition from the spring to the summer market, which is the opposite of a normal year, but this has not been a normal year,” said Valérie Paquin, CREA Chair. “Typically, we see a burst of new listings right at the beginning of September to kick off the fall market, but it seems like buyers are increasingly returning to the market. If you’re looking to buy or sell a property this fall, you should get in touch with a REALTOR® in your area today.”
There were 4.4 months of inventory on a national basis at the end of July 2025, dropping further below the long-term average of five months of inventory as sales continue to pick up. Based on one standard deviation above and below that long-term average, a seller’s market would be below 3.6 months and a buyer’s market would be above 6.4 months.
The National Composite MLS® Home Price Index (HPI) was unchanged between June and July 2025. Following declines in the first quarter of the year, the national benchmark price has remained mostly stable since May.
The non-seasonally adjusted National Composite MLS® HPI was down 3.4% compared to July 2024. This was a smaller decrease than the one recorded in June.
Based on the extent to which prices fell off in the second half of 2024, look for year-over-year declines to continue to shrink in the months ahead. (Chart B)
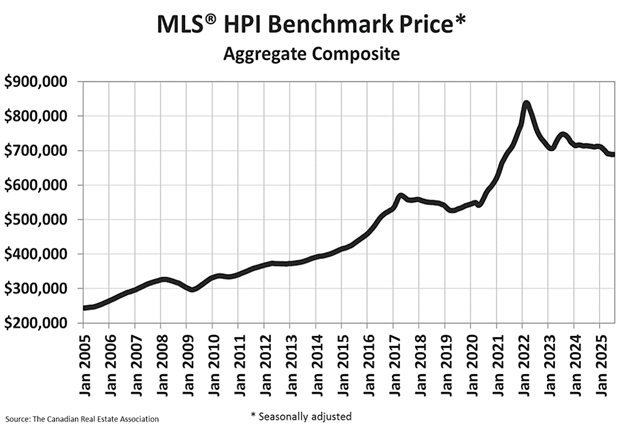
The non-seasonally adjusted national average home price was $672,784 in July 2025, edging up 0.6% from July 2024.
The next CREA statistics package will be published on Monday, September 15, 2025.