November 2025 Market Update: Single-Family Homes in the South Island
COWICHAN VALLEY
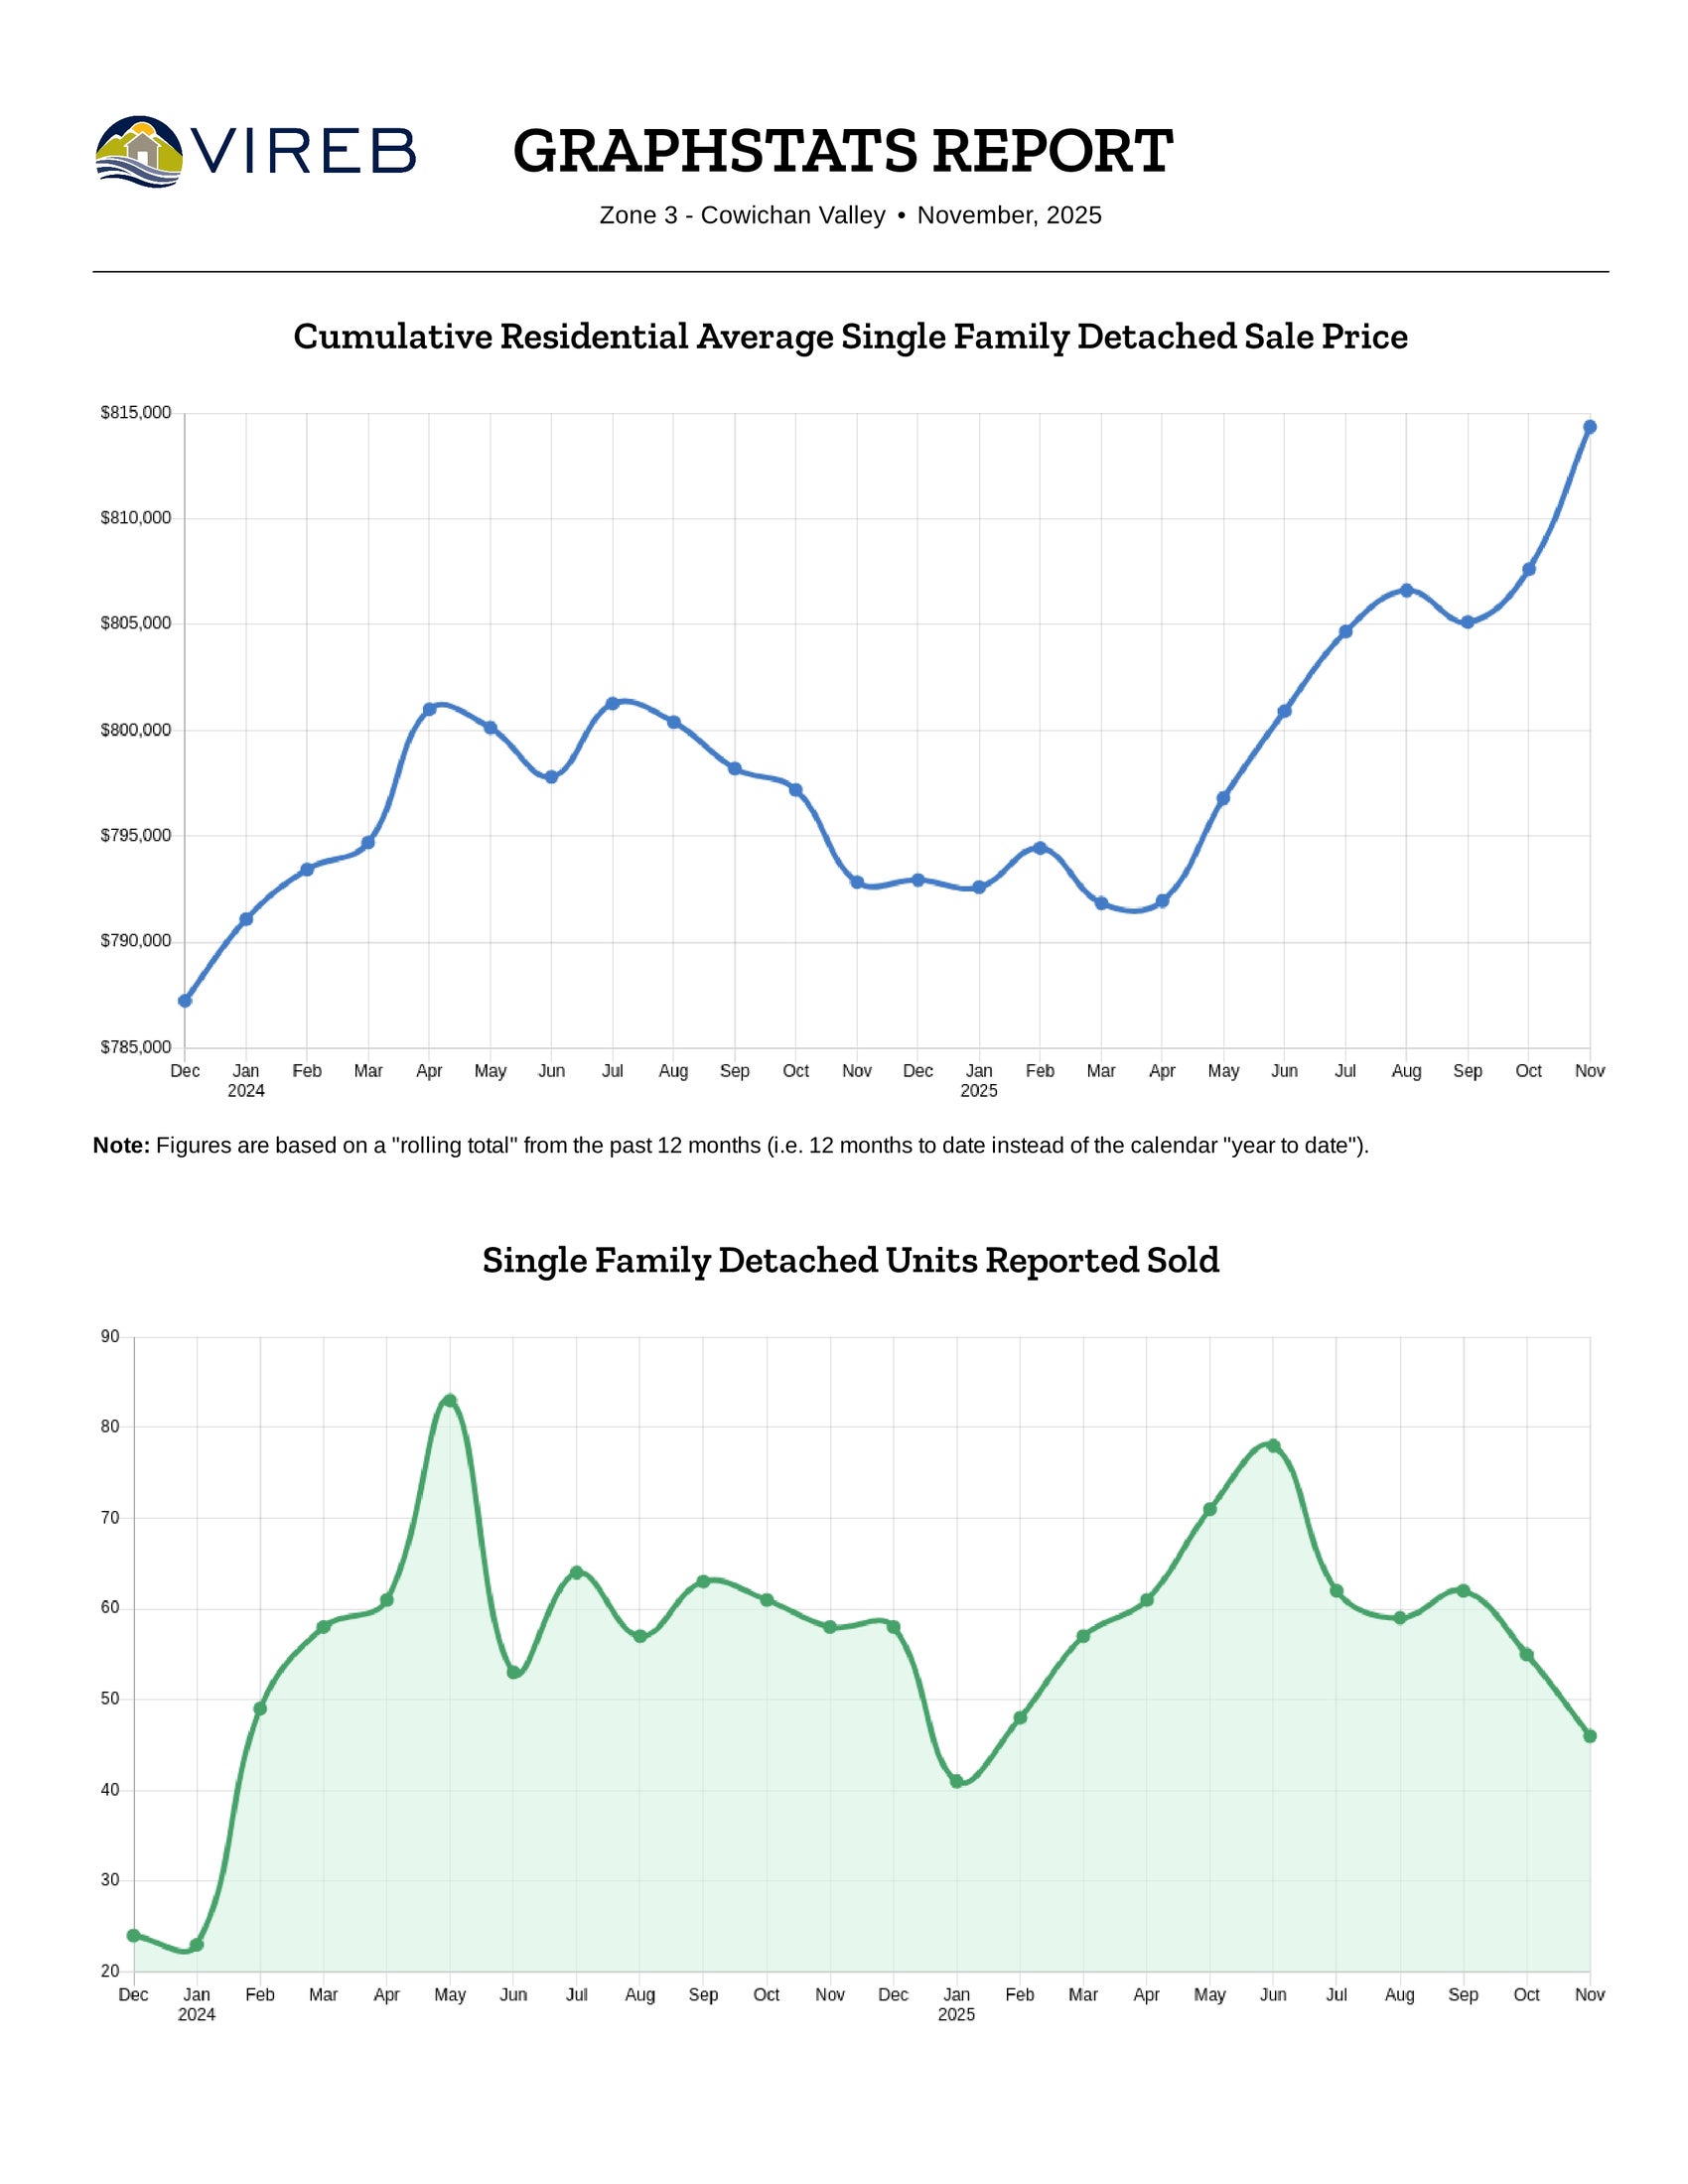
The Cowichan Valley single-family market is wrapping up 2025 in solid shape, with prices continuing to climb even as the pace of sales eases and inventory tightens. November’s average sale price landed in the mid‑$820,000s, up from last year and slightly above October, while homes are selling much faster than they were a year ago. For sellers, that means values remain well supported; for buyers, there is still a window of opportunity as new listings come to market—but the most appealing homes are not sitting for long.
Summary: As of November 2025, the average sale price for single-family homes was $826,509, with a sell-to-list ratio of just under 96.23%.
Sales Activity: A total of 46 single-family homes were sold in the Cowichan Valley during November 2025, marking a notable decrease from 58 homes sold in November 2024 and down from 56 homes in October 2025.
Listings & Inventory: The market saw 58 new single-family home listings in November 2025, a jump of 13.7% compared to 51 listings in November of last year. As of the end of November, 208 homes were actively listed, down considerably from 230 homes available at the same time last year.
Pricing Trends:
• The average sale price in November 2025 was $826,509, reflecting a significant increase from November 2024’s average of $741,750.
• Compared to October 2025’s average of $817,844, prices have strengthened slightly.
• For the 12-month period ending in November 2025, the median sale price stood at $790,000.
Annual Performance: Over the past 12 months, 698 single-family homes were sold, which represents a 6.7% increase compared to the 654 sales in the same period ending in November 2025. Despite the slower pace of sales, the average selling price for the year is up by 2.7%.
Market Supply & Days on Market:
• The supply of homes decreased to 5.2 months in November 2025, the same as 5.2 months in November 2024.
• Homes sold in November 2025 took an average of 18 days to sell, compared to 55 days in November last year.
This summary highlights the key market trends and performance for single-family homes in the Cowichan Valley, helping homeowners and buyers stay informed about the latest developments. Feel free to reach out for further details or if you need personalized advice!
Condo & Townhome Market Update
Condominiums
In November, the condominium market saw no change with 10 units sold, same as in October. However, sales are up/down from the 7 units sold in November of last year. The average price for condo apartments over the past 12 months ending in November 2025 rose to $349,252 - a 0.4% decrease from last year's average of $350,771.
Townhomes
The townhome market experienced a downward trend, with 7 sales in November, a decrease from both the 11 units sold in October and 13 in November 2024 (a 46.2% year-over-year decrease). The average price for townhomes over the past 12 months ending in November reached $559,305, down 1.5% from $568,071 during the same period last year.
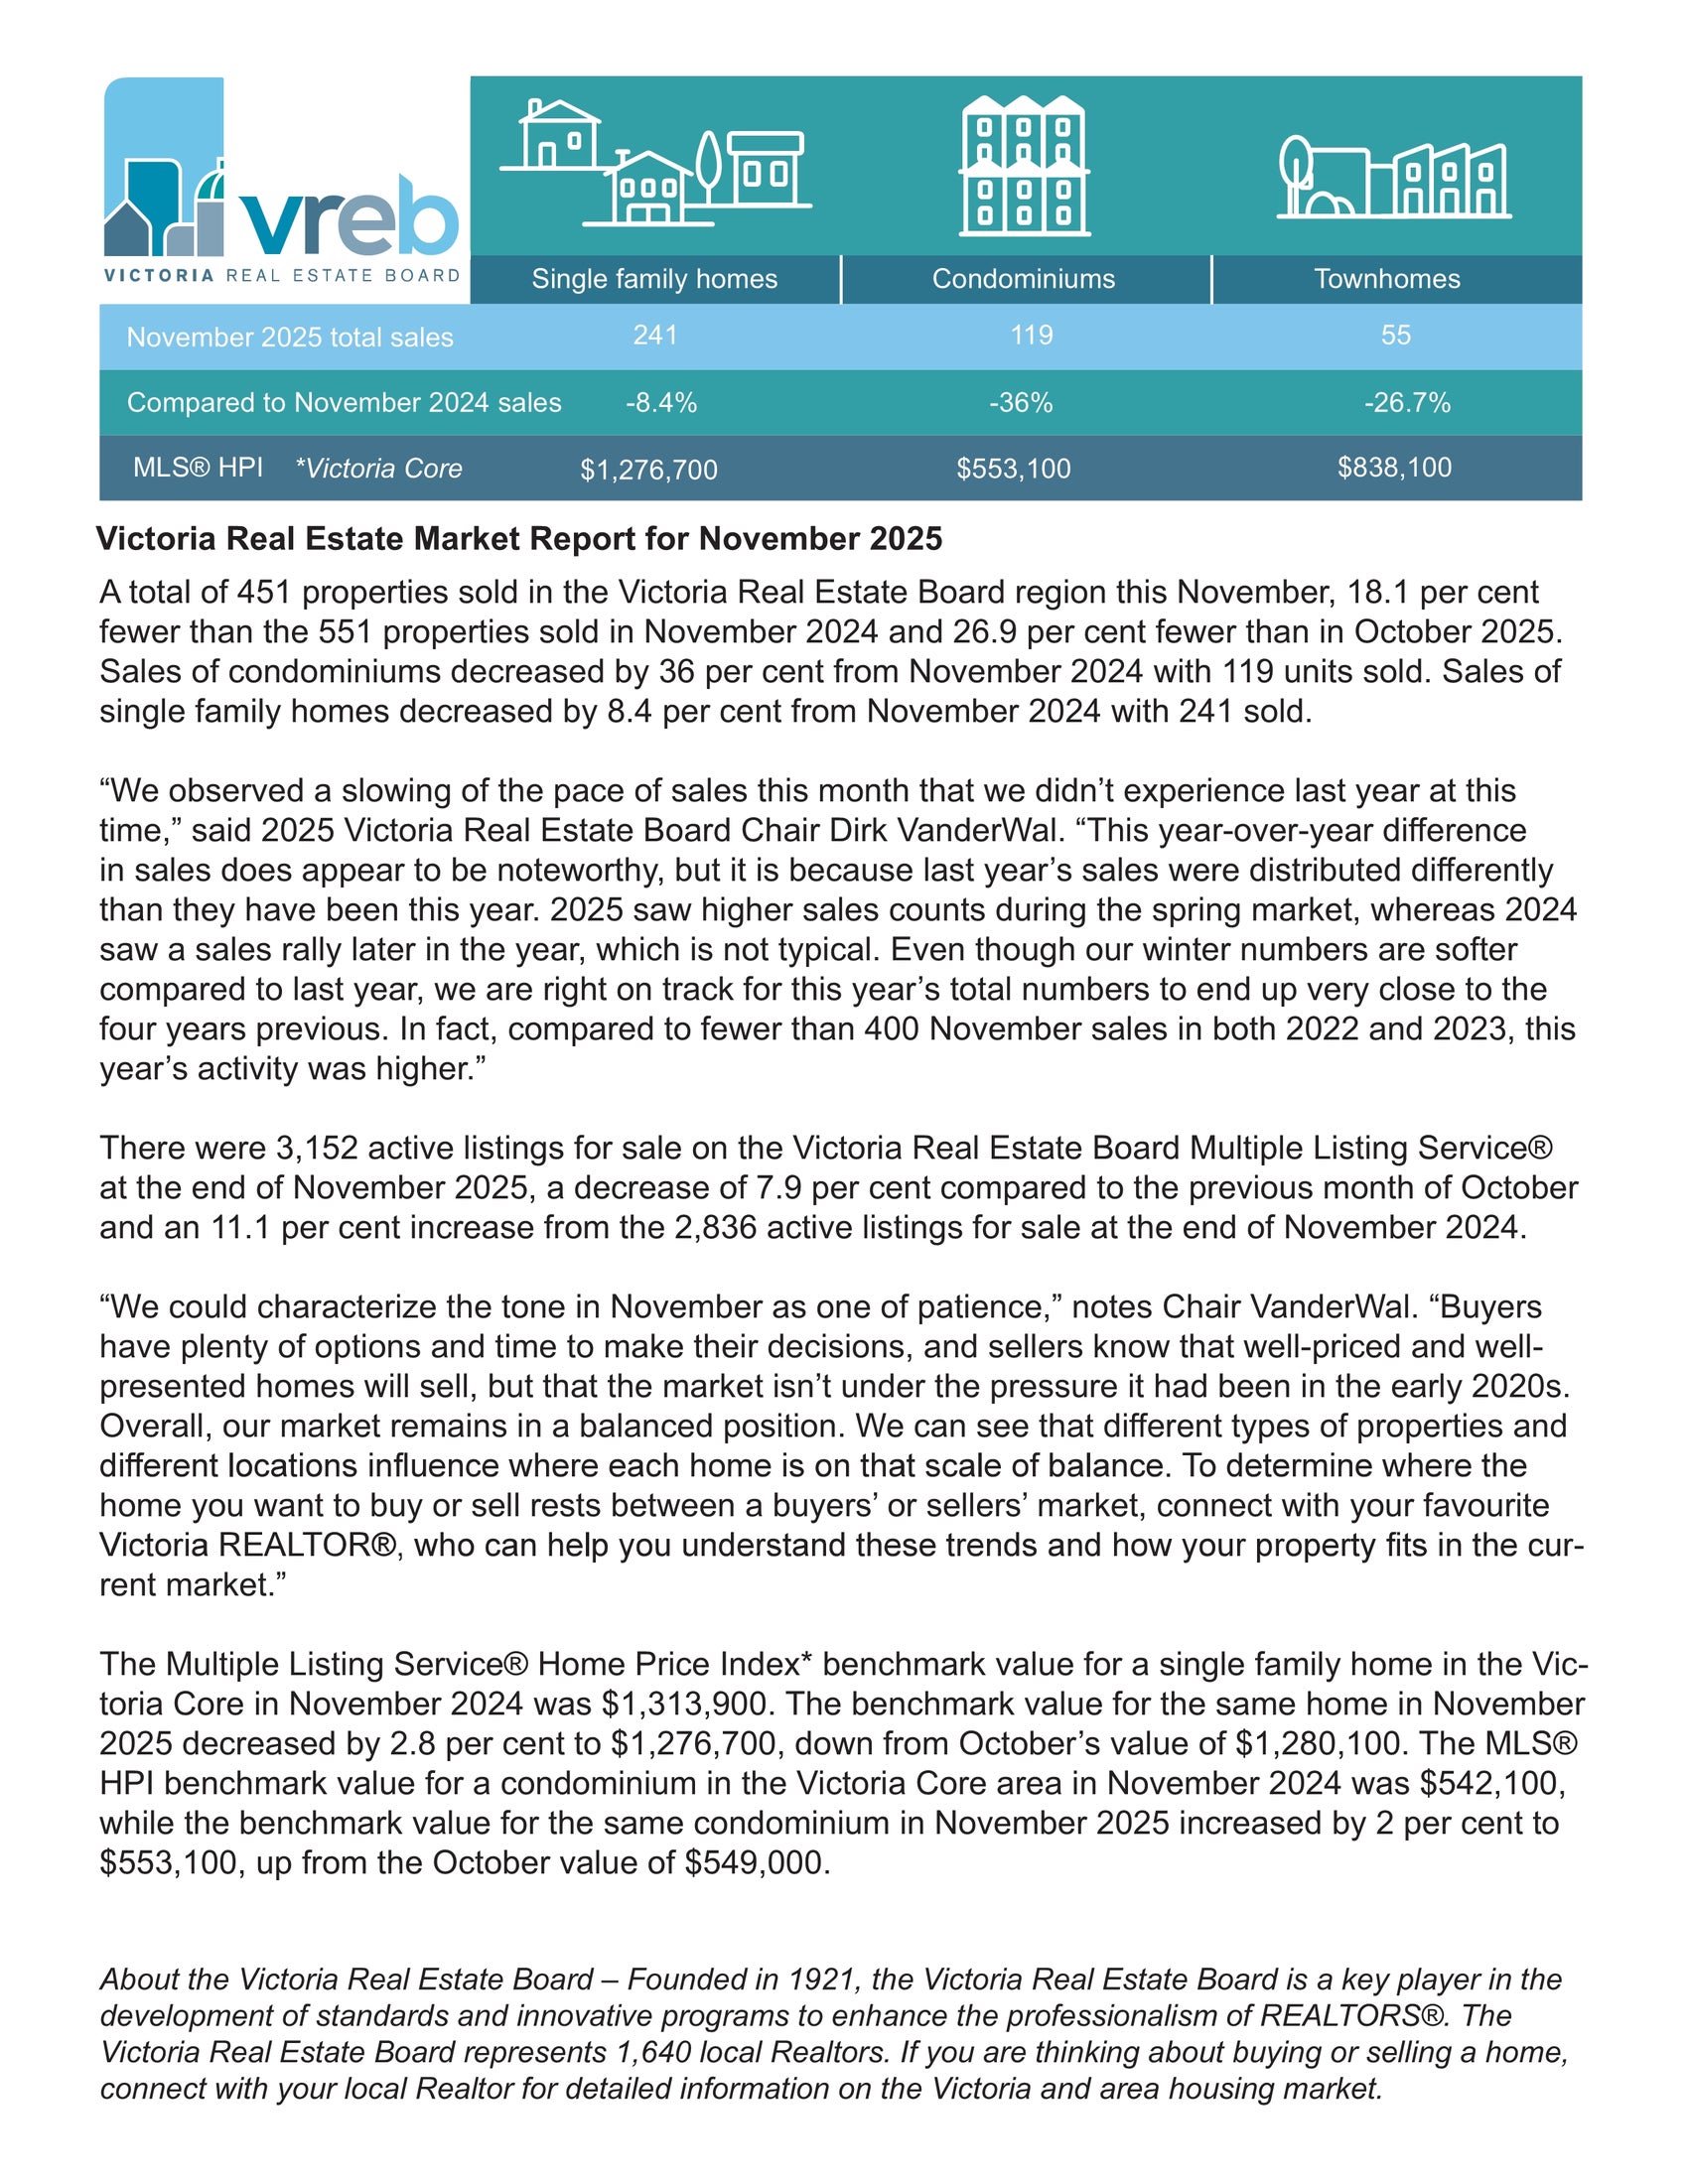
VICTORIA
Summary: In November 2025, the benchmark price for single-family homes in the Victoria Core reached $1,276,700, reflecting a 8.4% year-over-year decrease.

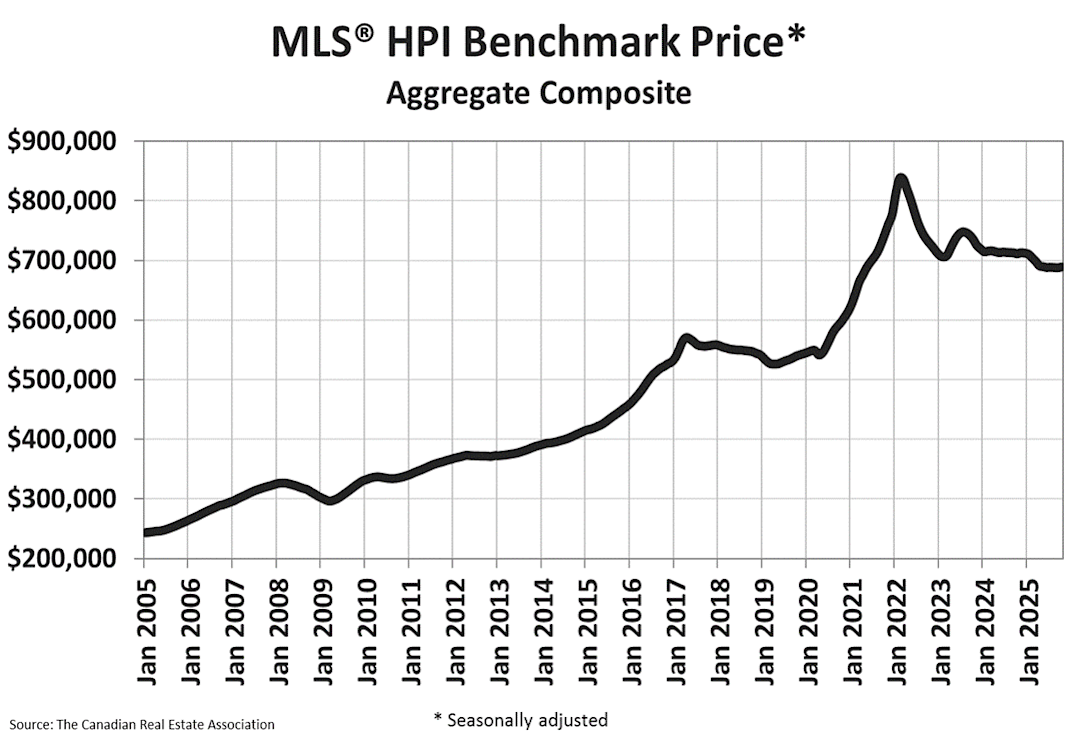
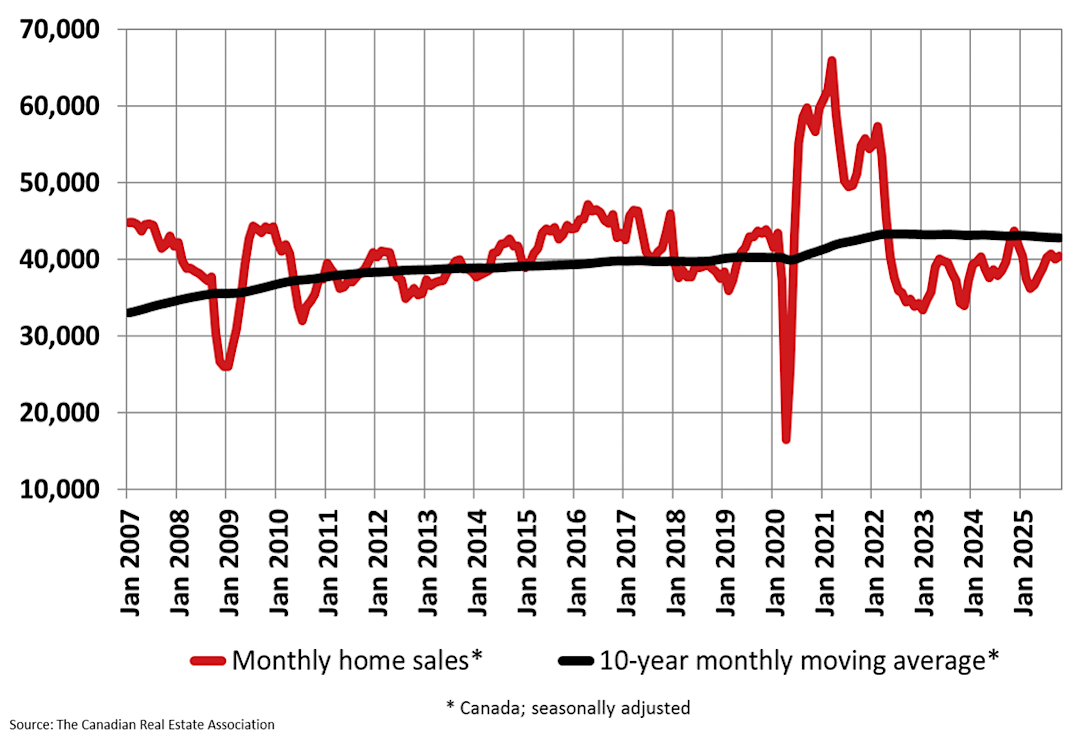
Ottawa, ON November 17, 2025 – The number of home sales recorded over Canadian MLS® Systems edged up 0.9% on a month-over-month basis in October 2025, marking six monthly gains in the last seven months. (Chart A)
“After a brief pause in September, home sales across Canada picked back up again in October, rejoining the trend in place since April,” said Shaun Cathcart, CREAʼs Senior Economist. “With interest rates now almost in stimulative territory, housing markets are expected to continue to become more active heading into 2026, although this is likely to be tempered by ongoing economic uncertainty.”
October Highlights:
▪ National home sales climbed 0.9% month-over-month.
▪ Actual (not seasonally adjusted) monthly activity came in 4.3% below October 2024.
▪ The number of newly listed properties declined 1.4% on a month-over-month basis.
▪ The MLS® Home Price Index (HPI) edged up 0.2% month-over-month but was down 3% on a year-over-year basis.
▪ The actual (not seasonally adjusted) national average sale price was down 1.1% on a year-over-year basis.
New supply declined 1.4% month-over-month in October. Combined with an increase in sales activity, the sales-to-new listings ratio tightened to 52.2% compared to 51% recorded in September. The long-term average for the national sales-to-new listings ratio is 54.9%, with readings roughly between 45% and 65% generally consistent with balanced housing market conditions.
There were 189,000 properties listed for sale on all Canadian MLS® Systems at the end of October 2025, up 7.2% from a year earlier but very close to the longterm average for that time of the year.
“As we head into the quiet winter season, we continue to see clues that underlying demand for housing is picking up steam,” said Valérie Paquin, CREA Chair. “All eyes will be on next yearʼs spring market to see if all that pent-up demand will finally come off the sidelines in a big way. If you want to be a part of that 2026 market, contact a local REALTOR® and start planning today.”
There were 4.4 months of inventory on a national basis at the end of October 2025, basically unchanged from July, August, and September and the lowest level since January. The long-term average for this measure of market balance is five months of inventory. Based on one standard deviation above and below that long-term average, a sellerʼs market would be below 3.6 months and a buyerʼs market would be above 6.4 months.
The National Composite MLS® Home Price Index (HPI) edged up 0.2% between September and October 2025. The non-seasonally adjusted National Composite MLS® HPI was down 3% compared to October 2024, the smallest year-over-year decline since March. (Chart B)